Open Access
Fig. C.2
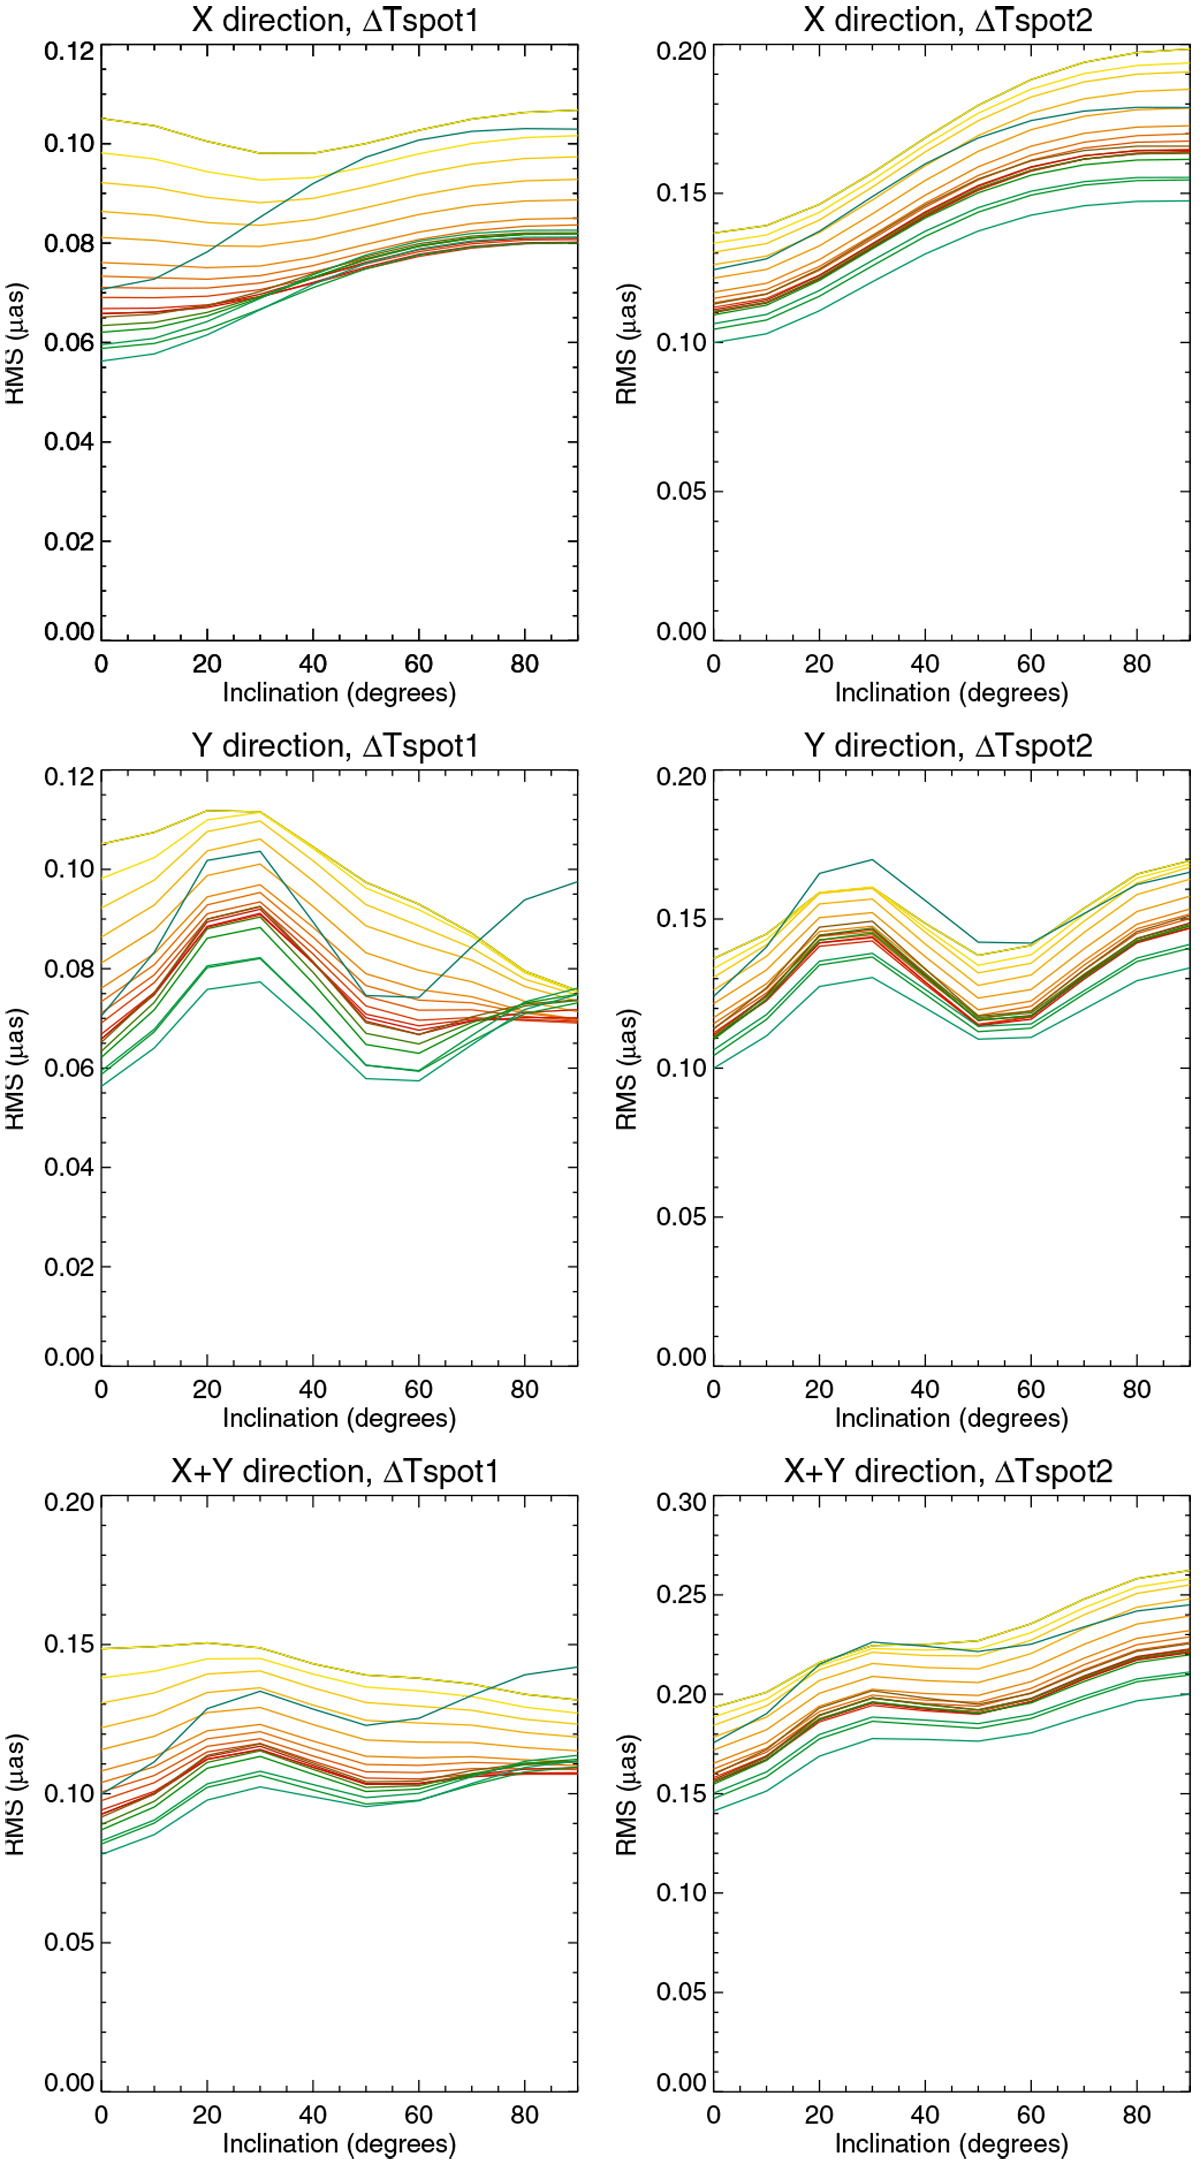
rms of time series in the X direction (upper panels) and the Y direction (middle panels), and combining both directions (low panels) for ΔTspot1 (left) and ΔTspot2 (right). The colour code represents the spectral type from F6 (yellow) to K4 (blue).
Current usage metrics show cumulative count of Article Views (full-text article views including HTML views, PDF and ePub downloads, according to the available data) and Abstracts Views on Vision4Press platform.
Data correspond to usage on the plateform after 2015. The current usage metrics is available 48-96 hours after online publication and is updated daily on week days.
Initial download of the metrics may take a while.