Open Access
Fig. C.1
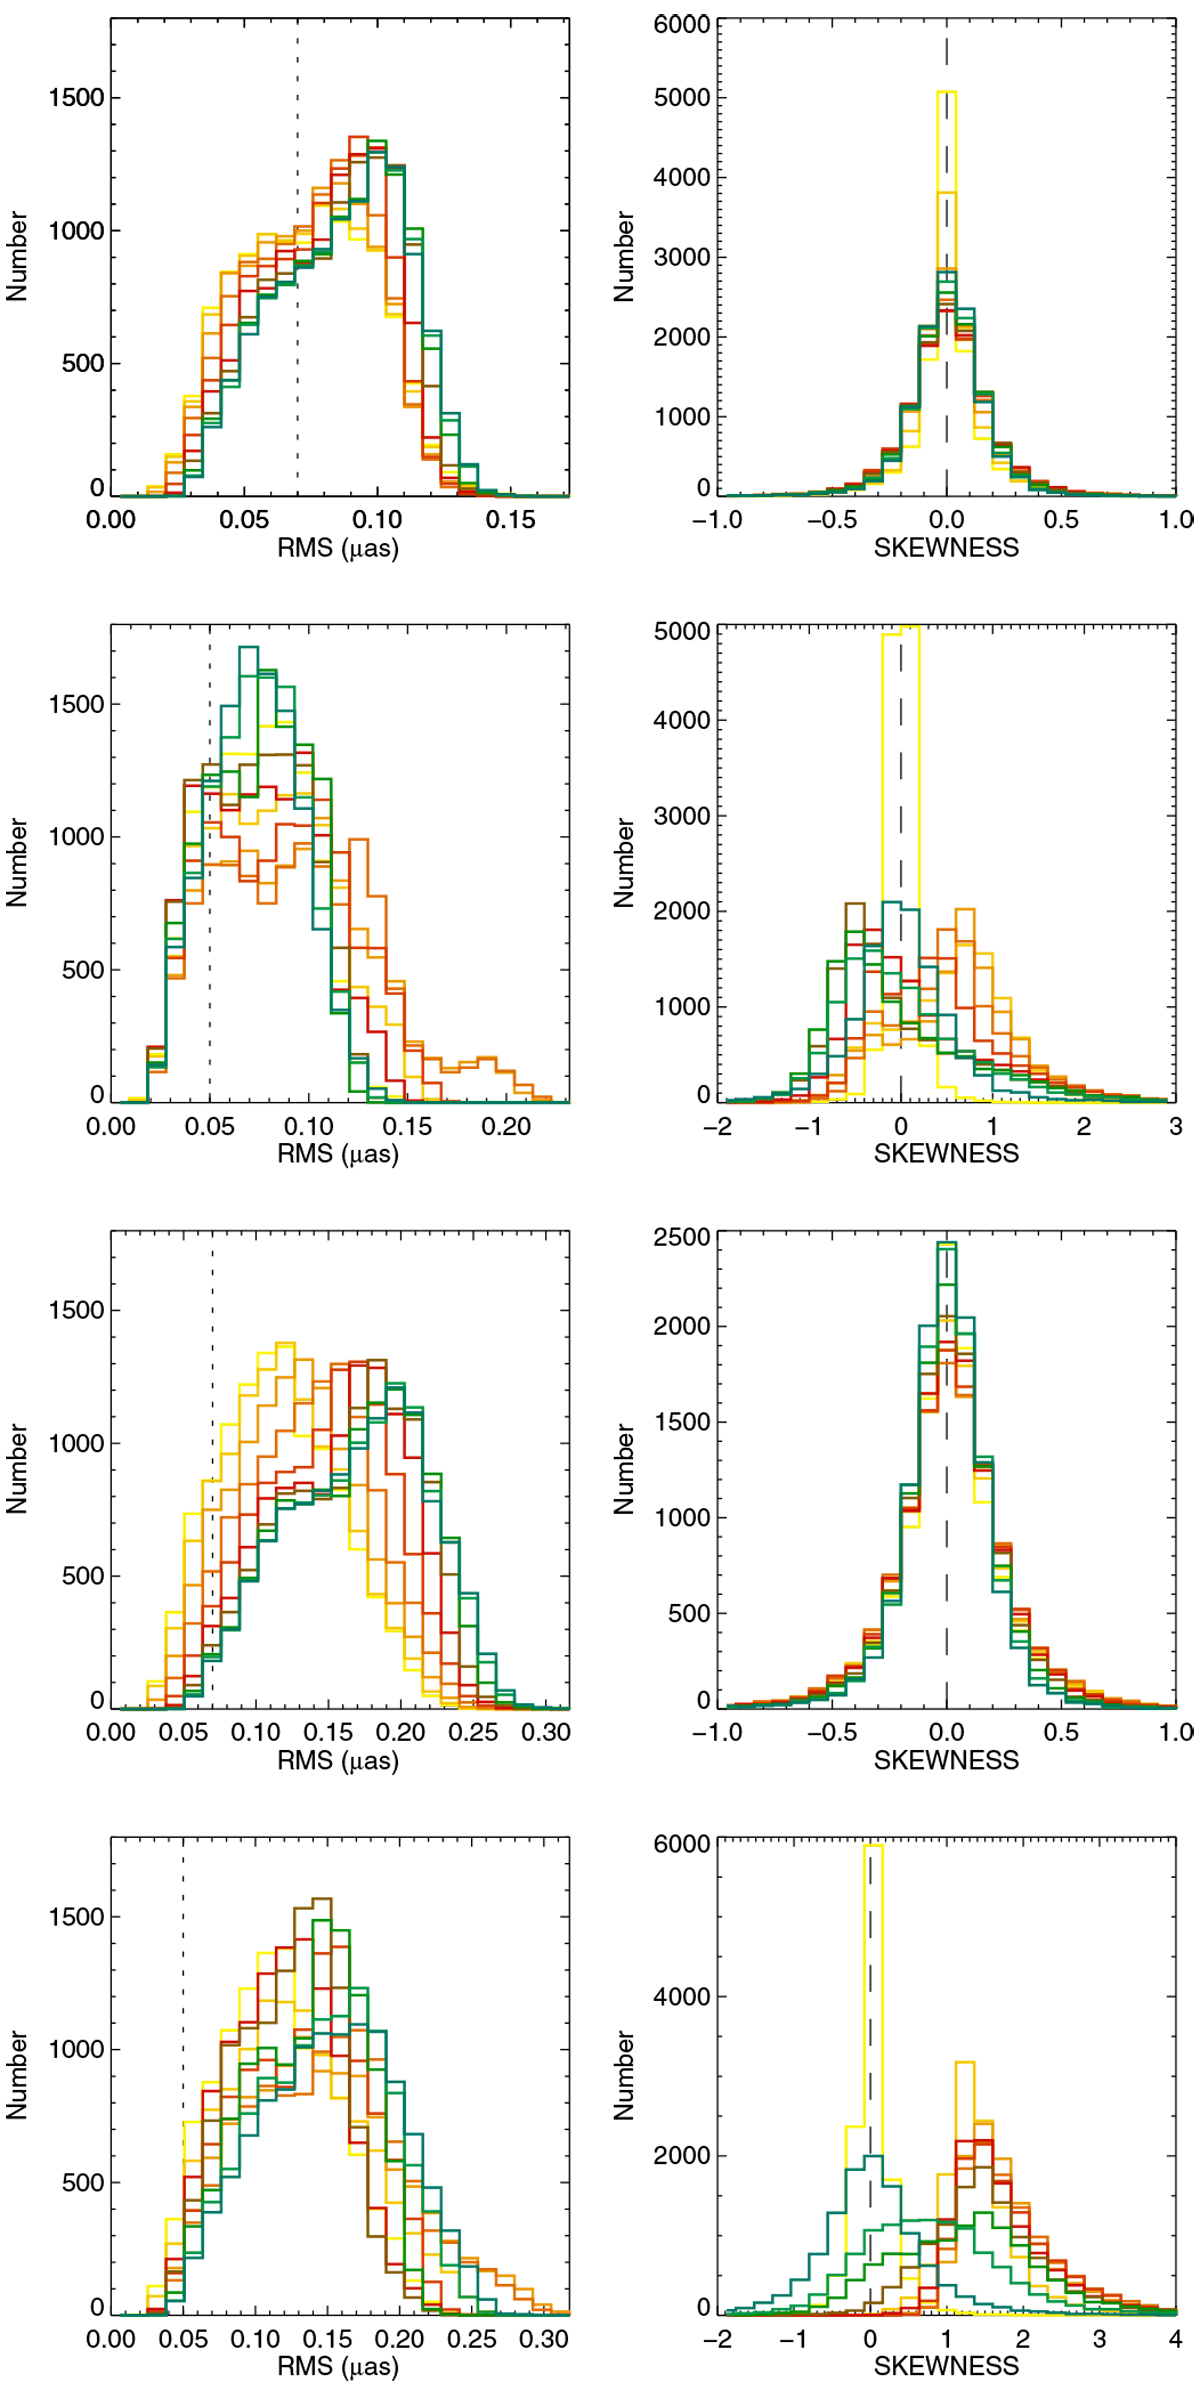
rms (left) and skewness (right) distributions of the activity time series in both directions for (from upper to lower panel) the X direction and ΔTspot1, the Y direction and ΔTspot1, the X direction and ΔTspot2, and the Y direction and ΔTspot2. Different curves show the ten inclinations (same colour code as in Fig. 1).
Current usage metrics show cumulative count of Article Views (full-text article views including HTML views, PDF and ePub downloads, according to the available data) and Abstracts Views on Vision4Press platform.
Data correspond to usage on the plateform after 2015. The current usage metrics is available 48-96 hours after online publication and is updated daily on week days.
Initial download of the metrics may take a while.