Fig. B.4
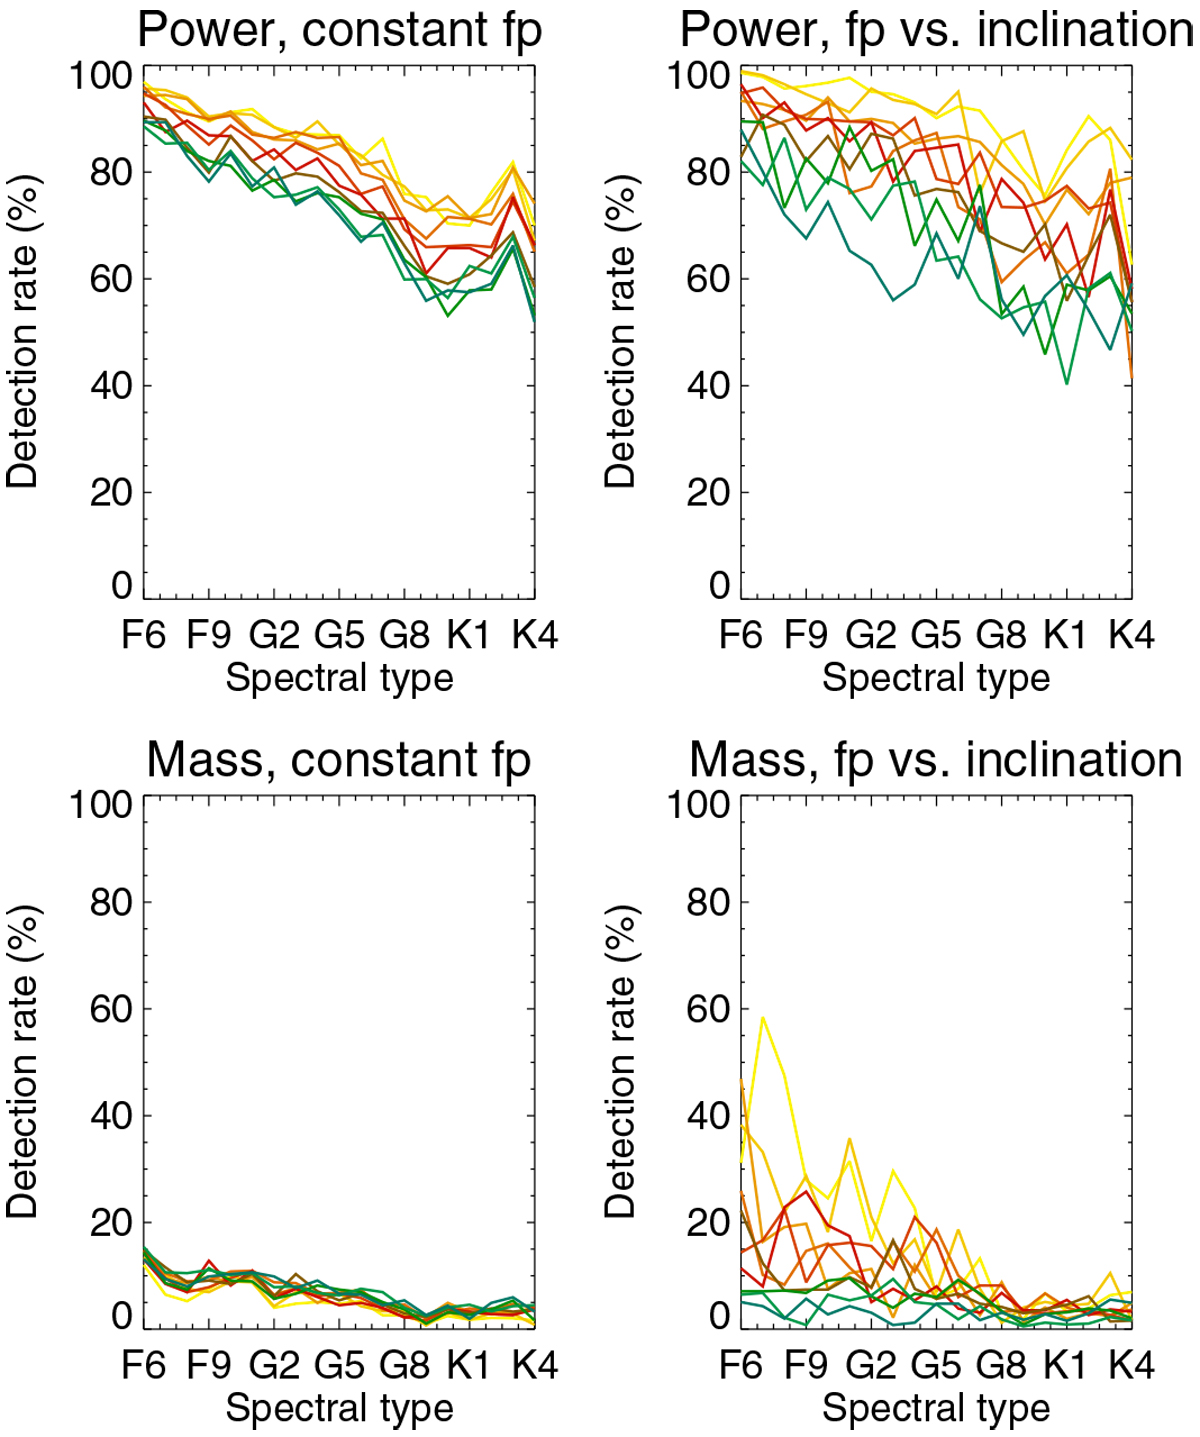
Detection rates vs. spectral type for 1 MEarth planet based for the frequential analysis (upper panel) and temporal analysis (lower panels), separately for ten inclinations (colour code as in Fig. 3). The detection rates are shown for ΔTspot2 and the inner side of the habitable zone. The fp levels depend on inclination for the right panels, but they do not for the left panels.
Current usage metrics show cumulative count of Article Views (full-text article views including HTML views, PDF and ePub downloads, according to the available data) and Abstracts Views on Vision4Press platform.
Data correspond to usage on the plateform after 2015. The current usage metrics is available 48-96 hours after online publication and is updated daily on week days.
Initial download of the metrics may take a while.