Open Access
Fig. B.3
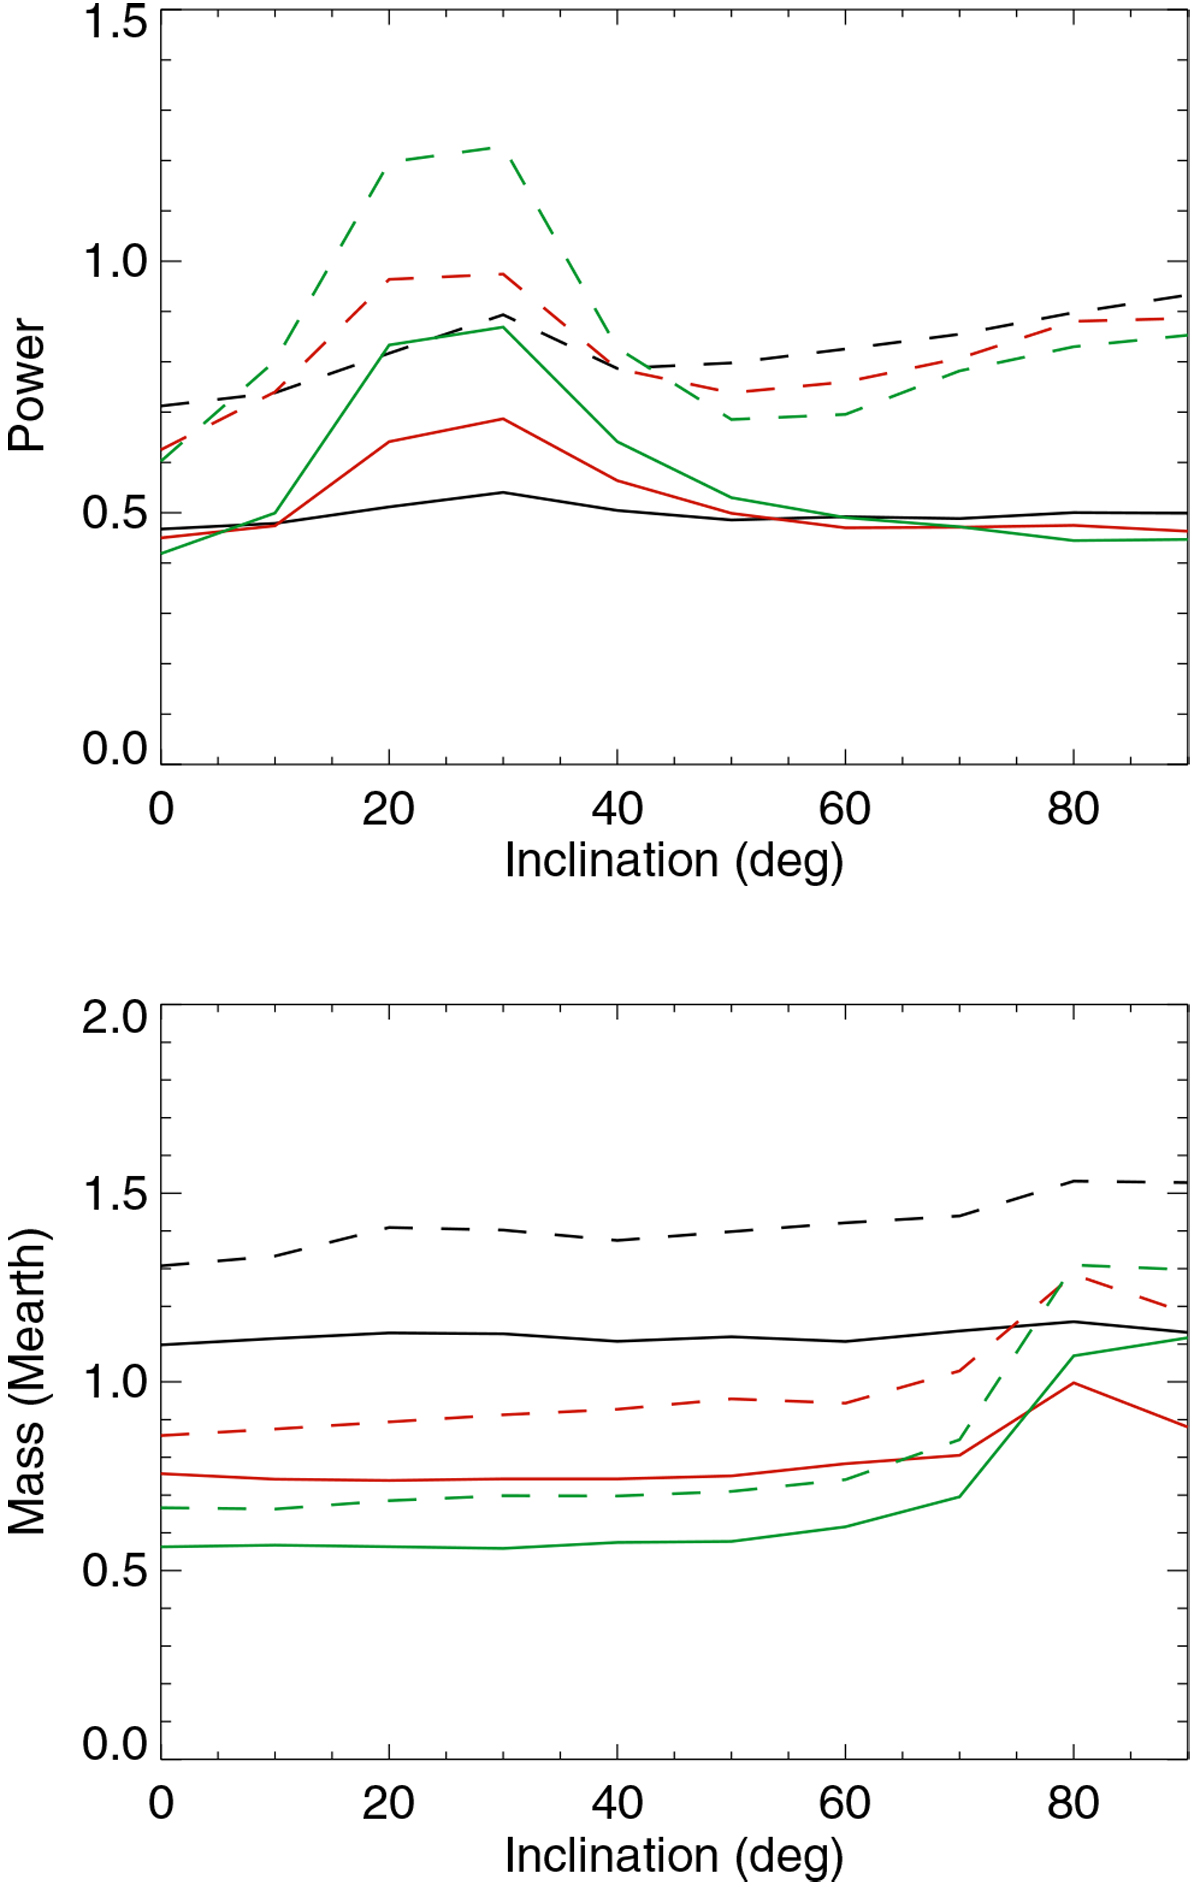
False positive fp averaged over all simulations vs. inclination for different PHZ (inner side in black, middle in red, and outer side in green) and for ΔTspot1 (solid line) and ΔTspot2 (dashed line) for the frequential analysis (upper panel) and temporal analysis (lower panel).
Current usage metrics show cumulative count of Article Views (full-text article views including HTML views, PDF and ePub downloads, according to the available data) and Abstracts Views on Vision4Press platform.
Data correspond to usage on the plateform after 2015. The current usage metrics is available 48-96 hours after online publication and is updated daily on week days.
Initial download of the metrics may take a while.