Fig. B.2
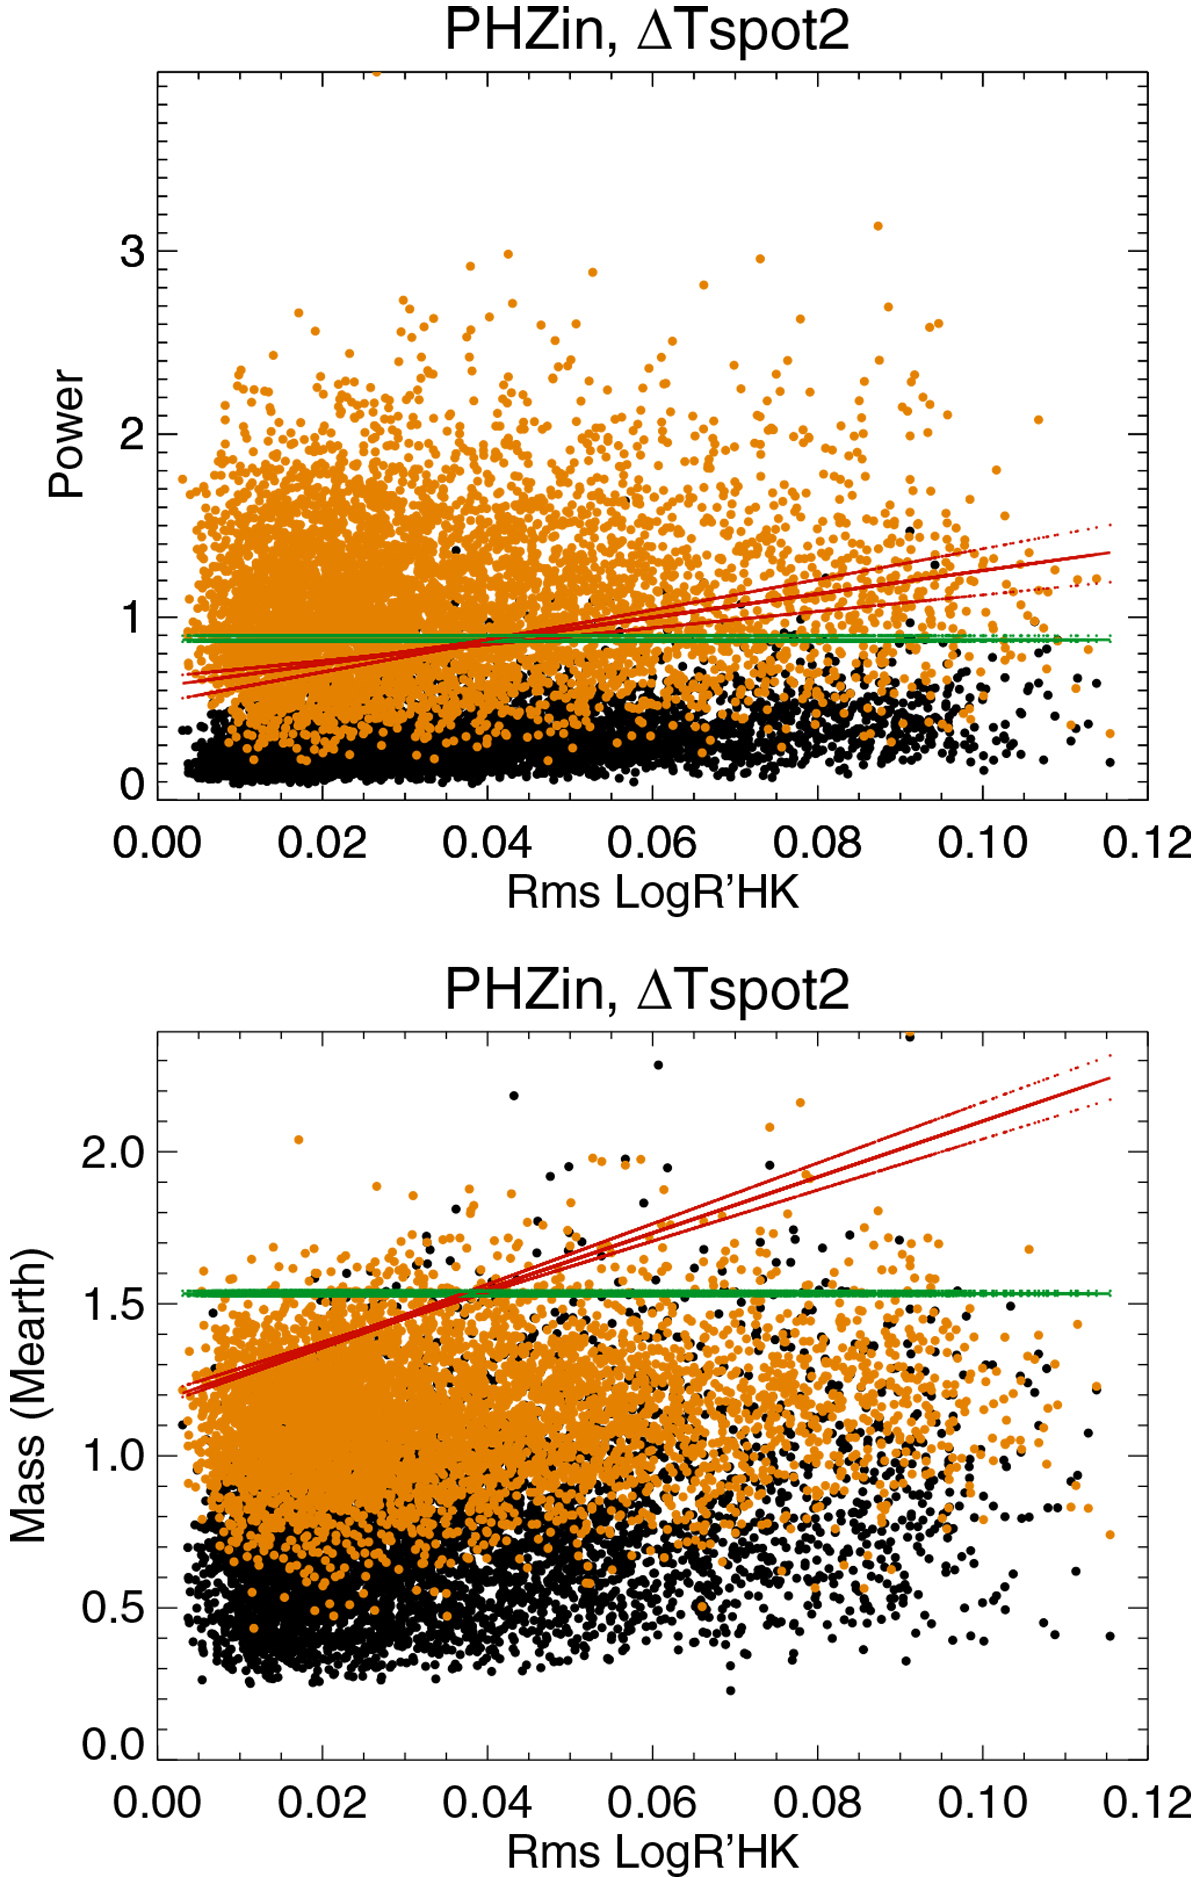
Illustration of fp computation for K2 stars, all inclinations, ΔTspot2,PHZin, representing power (frequential analysis, upper panel) and fitted mass (temporal analysis, lower panel) vs. rms of
![]() for no planet (black) and with an injected planet (orange, 1 MEarth). The green line corresponds to a constant fp level of 1%, and the red line shows a fp level depending on the rms of
for no planet (black) and with an injected planet (orange, 1 MEarth). The green line corresponds to a constant fp level of 1%, and the red line shows a fp level depending on the rms of
![]() . The green and red dots show the upper and lower bounds corresponding to the criterion (see text).
. The green and red dots show the upper and lower bounds corresponding to the criterion (see text).
Current usage metrics show cumulative count of Article Views (full-text article views including HTML views, PDF and ePub downloads, according to the available data) and Abstracts Views on Vision4Press platform.
Data correspond to usage on the plateform after 2015. The current usage metrics is available 48-96 hours after online publication and is updated daily on week days.
Initial download of the metrics may take a while.