Fig. C.1
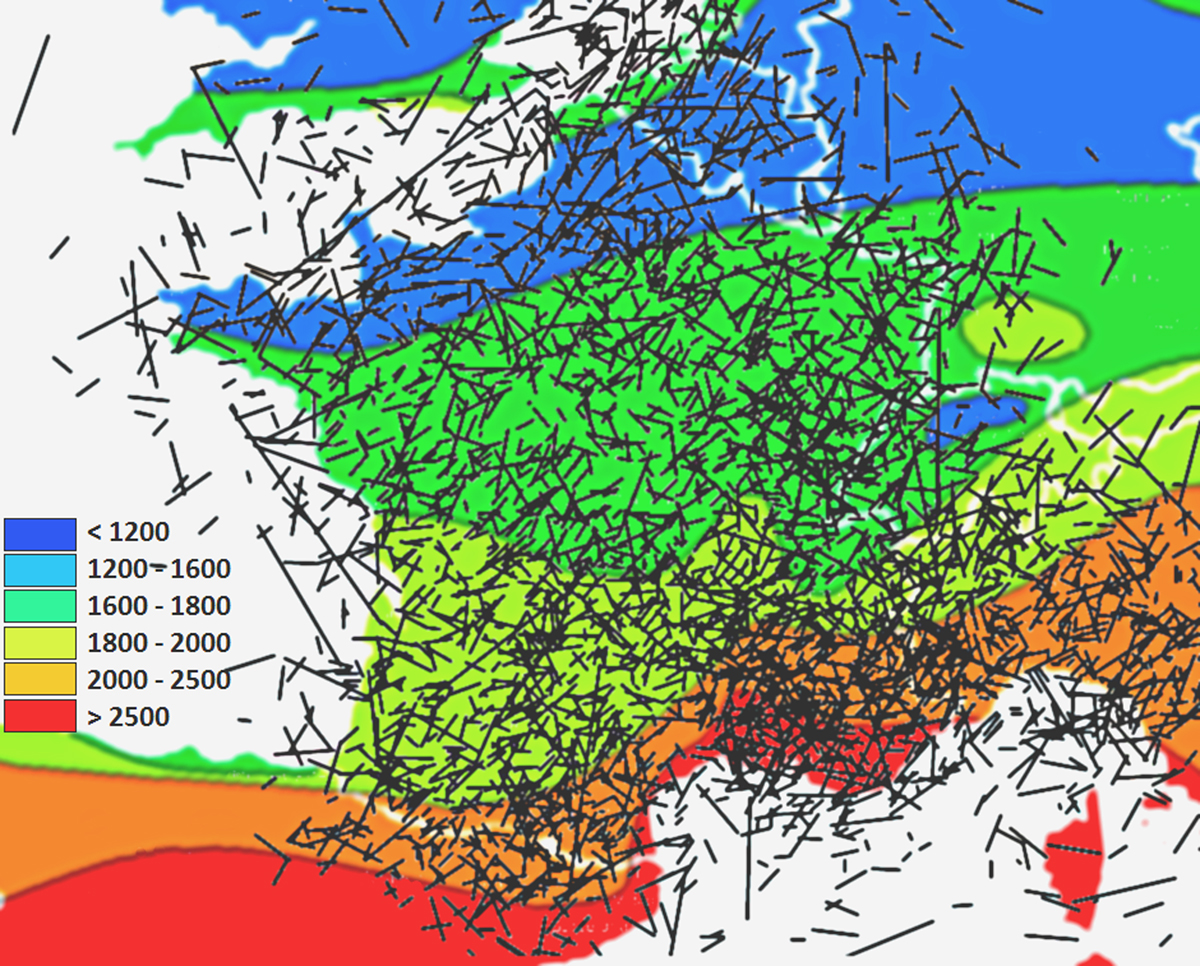
Map of the 3700 trajectories measured with FRIPON data from 2016 to early 2020. The concentration of detections is in part explained by the background sunshine weather map (sunshine duration in hours per year). The Rhône valley and the south of France have twice as many clear nights as the north. Another factor is that the installation of the cameras, done mostly throughout 2016, started in southern France and around Paris.
Current usage metrics show cumulative count of Article Views (full-text article views including HTML views, PDF and ePub downloads, according to the available data) and Abstracts Views on Vision4Press platform.
Data correspond to usage on the plateform after 2015. The current usage metrics is available 48-96 hours after online publication and is updated daily on week days.
Initial download of the metrics may take a while.