Fig. 7.
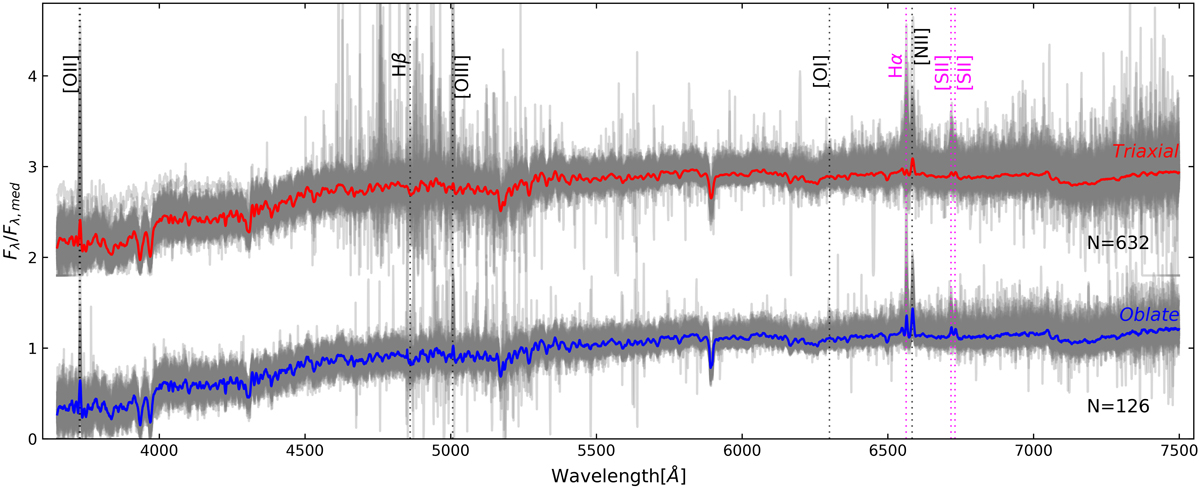
Stacking rest-frame spectra of T/O-type sources with L150 MHz < 1023 W Hz−1. The red T-type spectrum is the average of all round (q > 0.6) RLAGNs weighted by the possibility of each individual source being an intrinsic T-type. For clarity, the T-type stacking spectrum is shifted upwards. The blue O-type spectrum is derived in a similar way but using highly elongated (q < 0.4) RLAGNs and weighted by the possibility of each source being an intrinsic O-type. The grey shadows are the individual spectra of the sources used in the stacking. The emission lines needed for calculating the excitation index (Buttiglione et al. 2010) are marked in the figure.
Current usage metrics show cumulative count of Article Views (full-text article views including HTML views, PDF and ePub downloads, according to the available data) and Abstracts Views on Vision4Press platform.
Data correspond to usage on the plateform after 2015. The current usage metrics is available 48-96 hours after online publication and is updated daily on week days.
Initial download of the metrics may take a while.