Fig. 6.
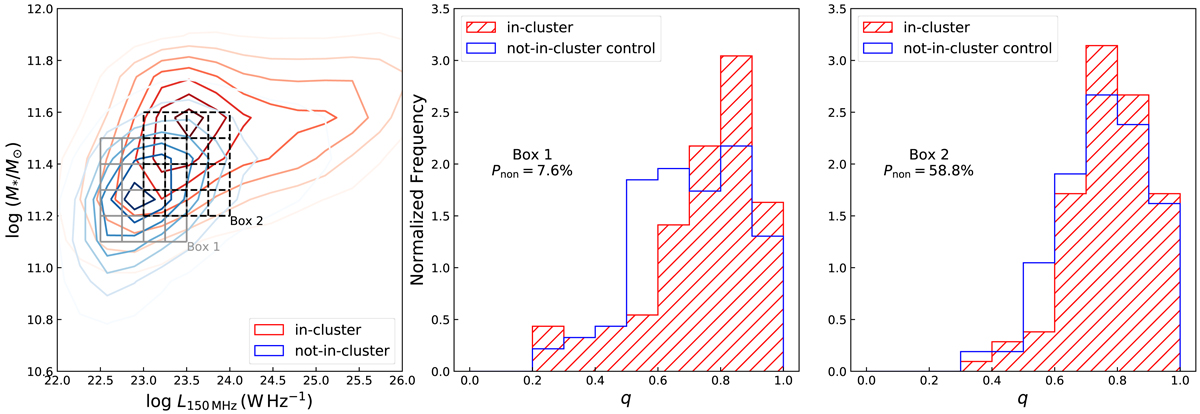
Left: distribution of RLAGNs with or without an associated cluster in L150 MHz–M* space. Red contours denote the distribution of in-cluster RLAGNs, while the blue contours denote the not-in-cluster RLAGNs (defined in Sect. 3.4). The grey lines (“Box 1”) and black dashed lines (“Box 2”) mark the L150 MHz and M* constraints and bins used in the control sample analysis in Sect. 3.4. The grey lines are for the low-power sample, while the black dashed lines are for the high-power sample. Middle and right: example of the q distributions of in-cluster RLAGNs (red shaded histograms) and the not-in-cluster control sample (blue histograms). The null hypothesis p-value from a K–S test (median value from 1000 tests) is noted.
Current usage metrics show cumulative count of Article Views (full-text article views including HTML views, PDF and ePub downloads, according to the available data) and Abstracts Views on Vision4Press platform.
Data correspond to usage on the plateform after 2015. The current usage metrics is available 48-96 hours after online publication and is updated daily on week days.
Initial download of the metrics may take a while.