Fig. 5.
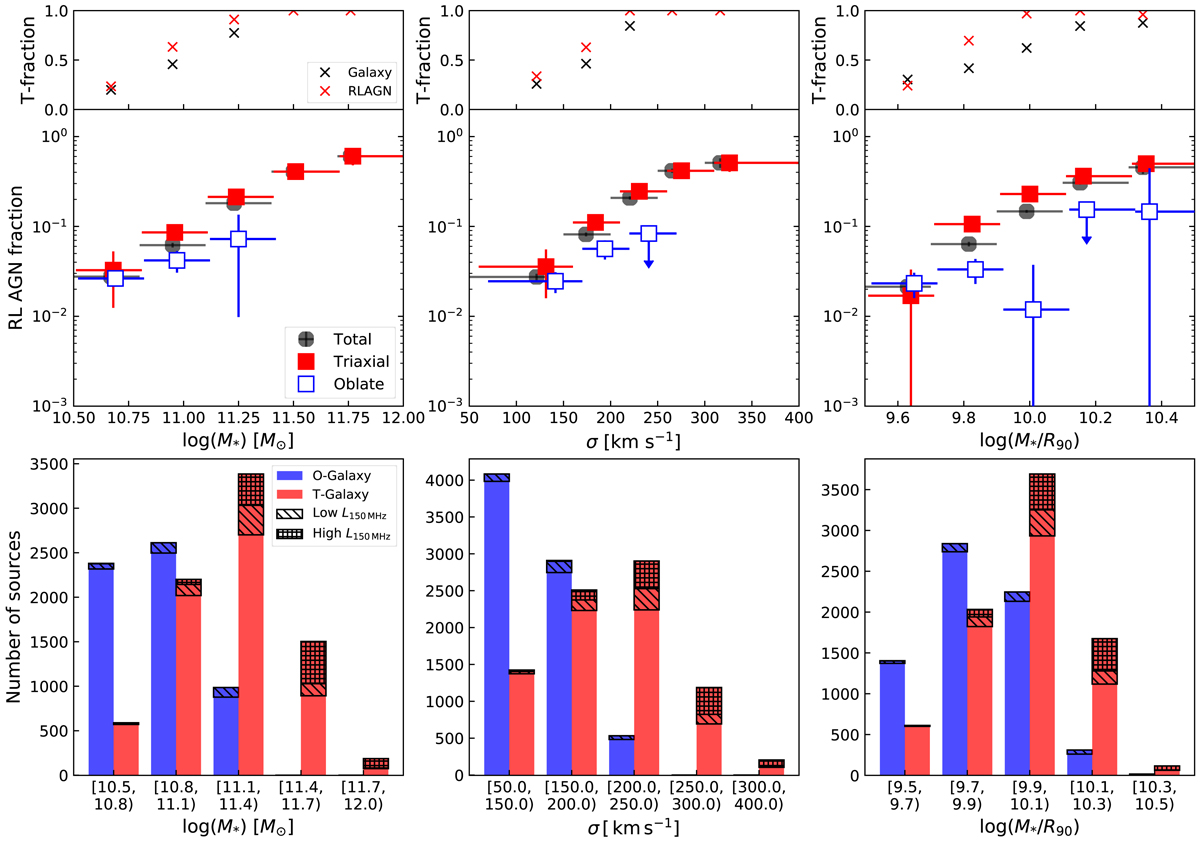
Top: triaxial source fractions as a function of M*, σ*, or M*/R90. The red crosses stand for the T-type fraction of the RLAGN sample and the black crosses are for the whole galaxy sample. Middle: radio-loud fraction of T/O-type sources as a function of M*, σ*, or M*/R90. Black points represent the whole sample, while the red(blue) rectangles are for the T(O)-type sample. Arrows mean that the corresponding points are upper limits. The horizontal error bars denote the bin sizes. The positions of the T(O)-type results are slightly shifted rightwards for clarity. Bottom: detailed decomposition results shown as bar charts. The red(blue) bars are the estimated numbers of the T(O)-type galaxies in different groups. The RLAGN results are overlaid as shaded areas on the galaxy results. Low- and high-power RLAGNs are marked with different hatching.
Current usage metrics show cumulative count of Article Views (full-text article views including HTML views, PDF and ePub downloads, according to the available data) and Abstracts Views on Vision4Press platform.
Data correspond to usage on the plateform after 2015. The current usage metrics is available 48-96 hours after online publication and is updated daily on week days.
Initial download of the metrics may take a while.