Fig. 4.
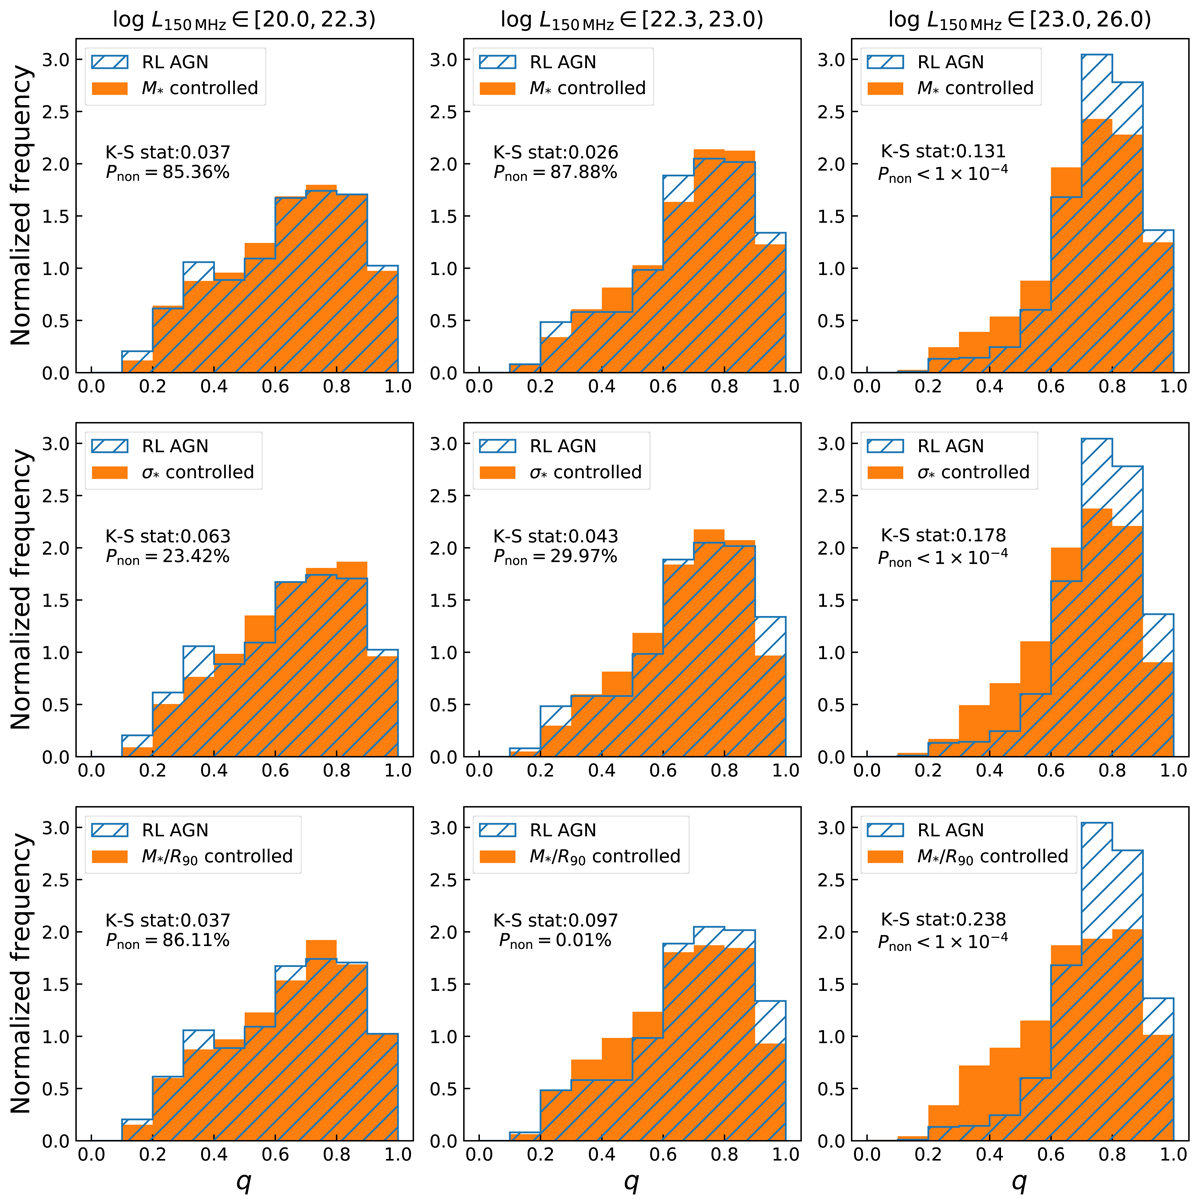
Normalized q distributions of RLAGN hosts with different radio power and their control sample. From top to bottom: q distributions of RLAGN hosts and M*, σ*- and M*/R90 – controlled sample. From left to right: q distributions of low-, intermediate-, and high-power RLAGN hosts and their control sample. The orange histograms show the distribution of “normal” galaxies, while the blue hatched histograms show the distribution of the RLAGN hosts. The p-values from K–S tests are listed in the panels. All the histograms are normalized for comparison.
Current usage metrics show cumulative count of Article Views (full-text article views including HTML views, PDF and ePub downloads, according to the available data) and Abstracts Views on Vision4Press platform.
Data correspond to usage on the plateform after 2015. The current usage metrics is available 48-96 hours after online publication and is updated daily on week days.
Initial download of the metrics may take a while.