Free Access
Fig. 3.
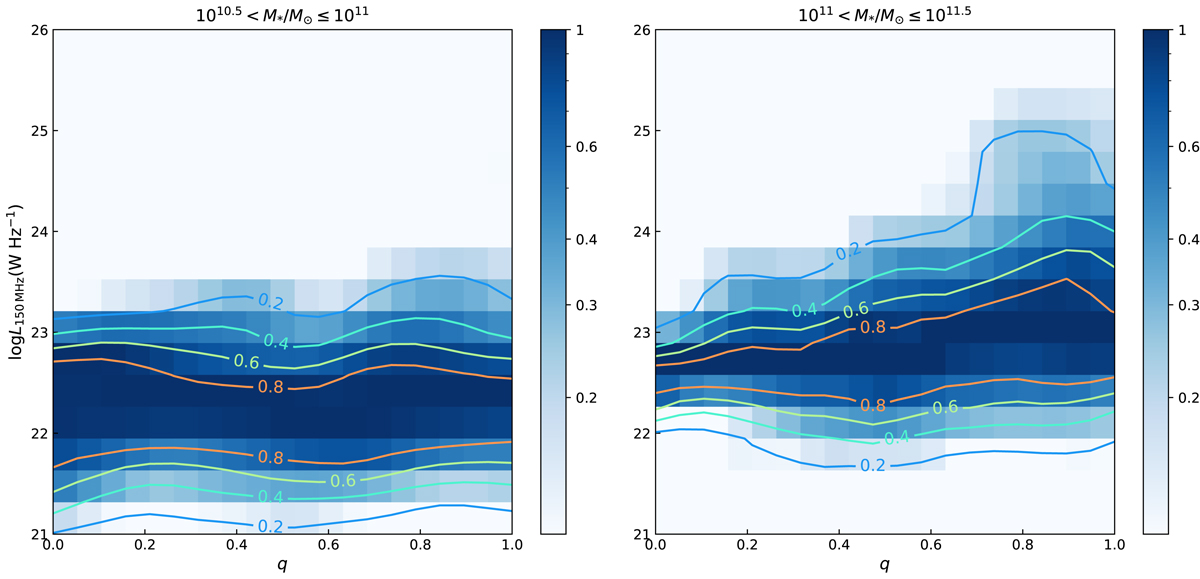
Normalized distribution of RLAGN at fixed M* in the L150 MHz–q plane. Kernel-density estimation was performed to reduce the error from binning. The colour of each cell represents the source number relative to the maximum source number cell at fixed q.
Current usage metrics show cumulative count of Article Views (full-text article views including HTML views, PDF and ePub downloads, according to the available data) and Abstracts Views on Vision4Press platform.
Data correspond to usage on the plateform after 2015. The current usage metrics is available 48-96 hours after online publication and is updated daily on week days.
Initial download of the metrics may take a while.