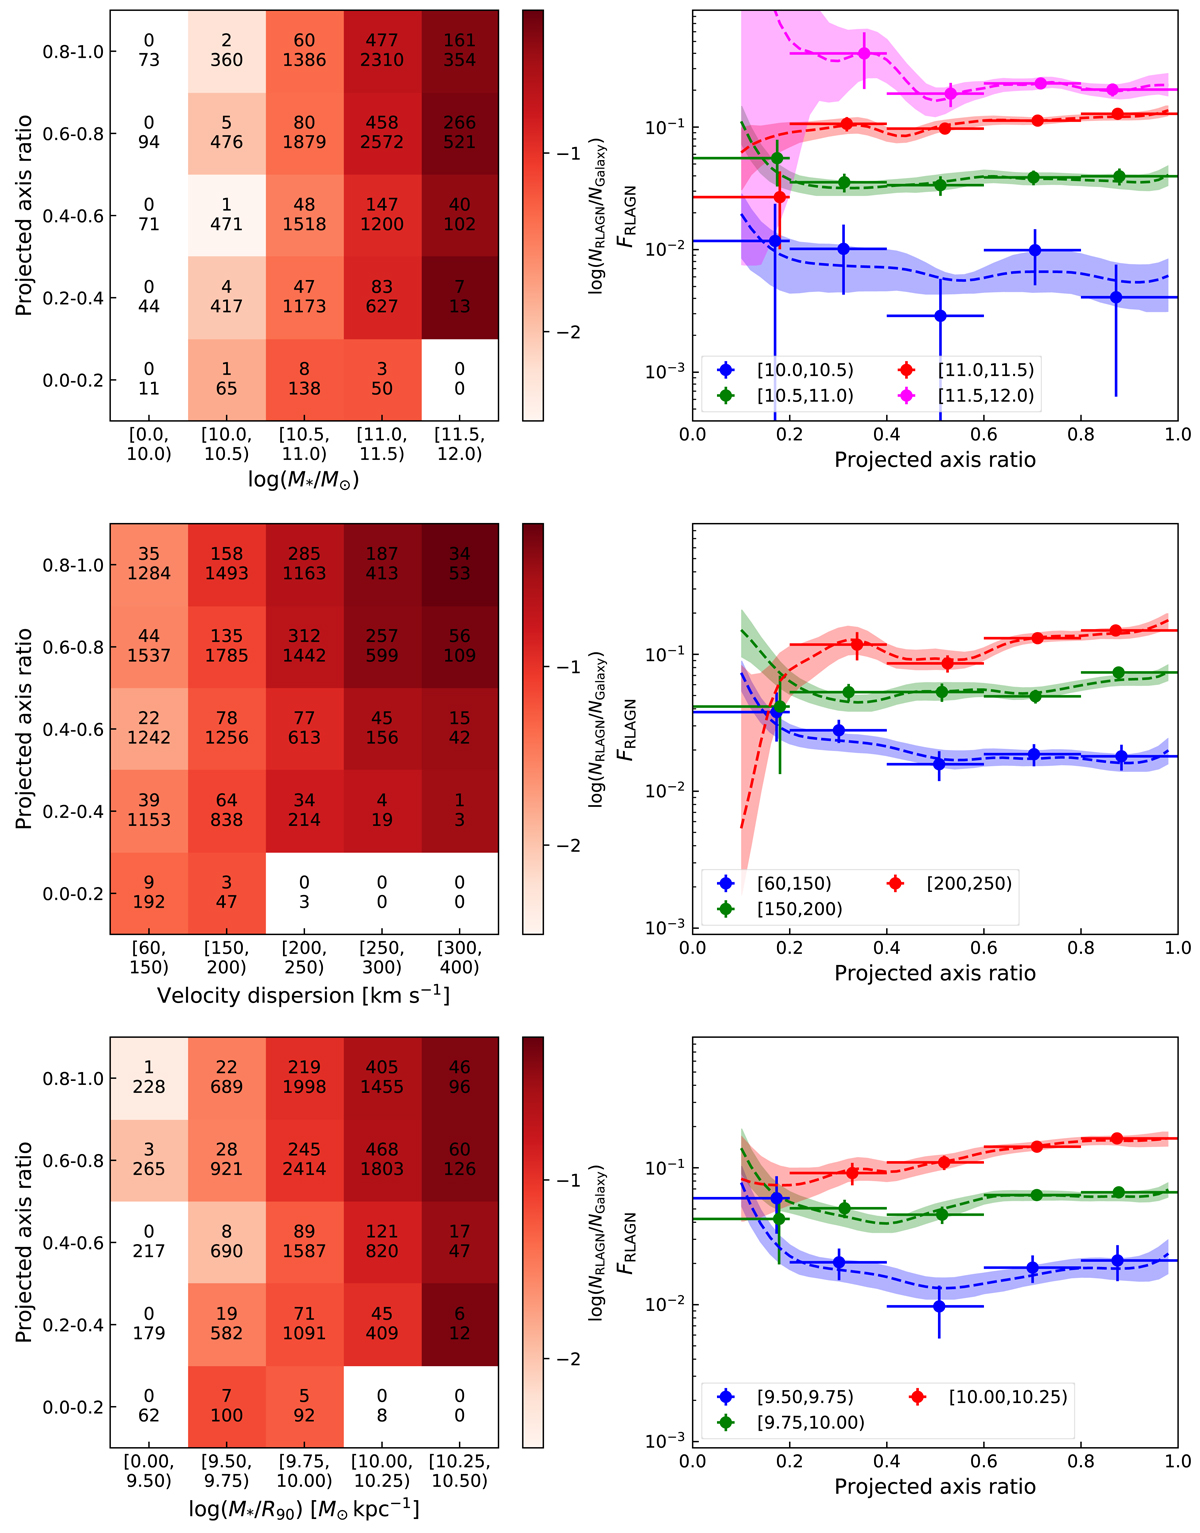
Fig. 2.

Top left: numbers of RLAGNs (top numbers) and galaxies (bottom numbers) in different groups of projected axis ratio in r band and M*. Top right: fraction of RLAGNs as a function of host galaxy projected axis ratio in different M* ranges. Results for different M* groups are colour coded. The ranges of M* are shown in the legend. The KDE-based (see text) results are displayed in dashed lines. The shaded areas represent the 1-σ errors of the KDE results derived from 500 bootstraps. Middle: similar to the top two panels but grouped based on the stellar velocity dispersion σ* provided in the MPA-JHU catalogue (Brinchmann et al. 2004). The results for the two largest σ* groups are not shown in the right panel because the results are affected by the noticeable larger M* at larger q in these groups. Bottom: similar to the top two panels but grouped based on M*/R90. The results for the largest and smallest M*/R90 groups are not shown because of the possible bias and the small number of RLAGNs.
Current usage metrics show cumulative count of Article Views (full-text article views including HTML views, PDF and ePub downloads, according to the available data) and Abstracts Views on Vision4Press platform.
Data correspond to usage on the plateform after 2015. The current usage metrics is available 48-96 hours after online publication and is updated daily on week days.
Initial download of the metrics may take a while.


