Fig. 1.
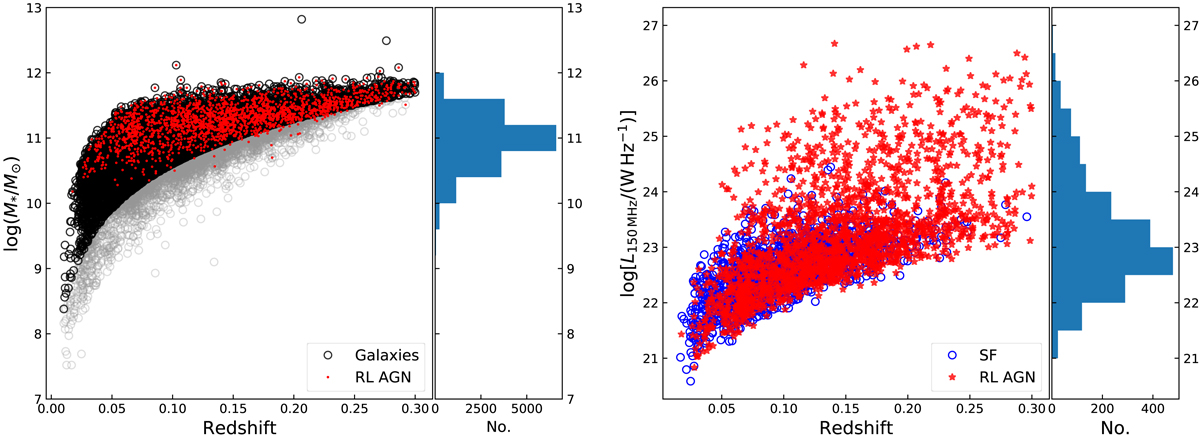
Left: stellar mass vs. redshift for the galaxies sample. The black circles are galaxies in our final sample, while the RLAGN hosts are denoted with red points. The grey circles are galaxies outside the mass completeness limit. Radio-loud AGNs in this part are not used in the analysis. The histogram shows the distribution of the final galaxy sample. Right: radio luminosity vs. redshift for the radio sources in the final sample. The red stars denote RLAGNs while the blue circles are SF galaxies from radio analysis in S19. The histogram on the right represents the L150 MHz distribution of the RLAGNs in the final sample.
Current usage metrics show cumulative count of Article Views (full-text article views including HTML views, PDF and ePub downloads, according to the available data) and Abstracts Views on Vision4Press platform.
Data correspond to usage on the plateform after 2015. The current usage metrics is available 48-96 hours after online publication and is updated daily on week days.
Initial download of the metrics may take a while.