Fig. 5
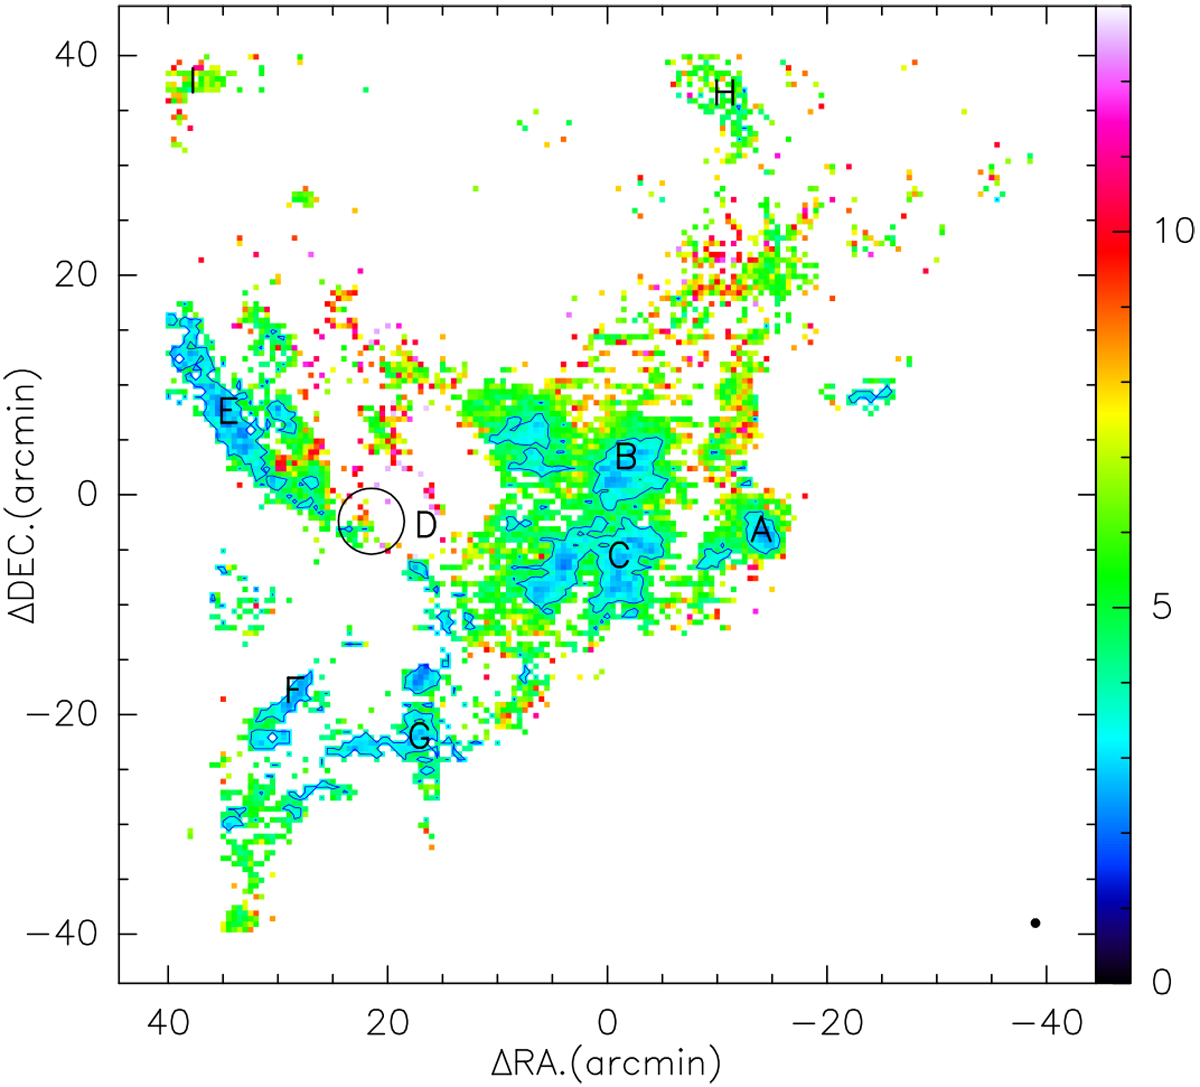
Map of the abundance ratio ![]() /
/![]() . The contours show the value of
. The contours show the value of ![]() /
/![]() = 4. The letters A to I present the selected regions where the abundance ratio is lower (A, B, C, E, F, and G) and much higher (region D), and the outskirts (H and I). The black circle presents the location of the W 40 H II region (radius
∽ 3′) and the black filled circle in the bottom-right illustrates the beam size of 60′′. The clippinglevel for the 13CO and C18O data is the S/N greater than five. High abundance-ratio values are distributed only in region D and reach up to 42.
= 4. The letters A to I present the selected regions where the abundance ratio is lower (A, B, C, E, F, and G) and much higher (region D), and the outskirts (H and I). The black circle presents the location of the W 40 H II region (radius
∽ 3′) and the black filled circle in the bottom-right illustrates the beam size of 60′′. The clippinglevel for the 13CO and C18O data is the S/N greater than five. High abundance-ratio values are distributed only in region D and reach up to 42.
Current usage metrics show cumulative count of Article Views (full-text article views including HTML views, PDF and ePub downloads, according to the available data) and Abstracts Views on Vision4Press platform.
Data correspond to usage on the plateform after 2015. The current usage metrics is available 48-96 hours after online publication and is updated daily on week days.
Initial download of the metrics may take a while.