Fig. 2
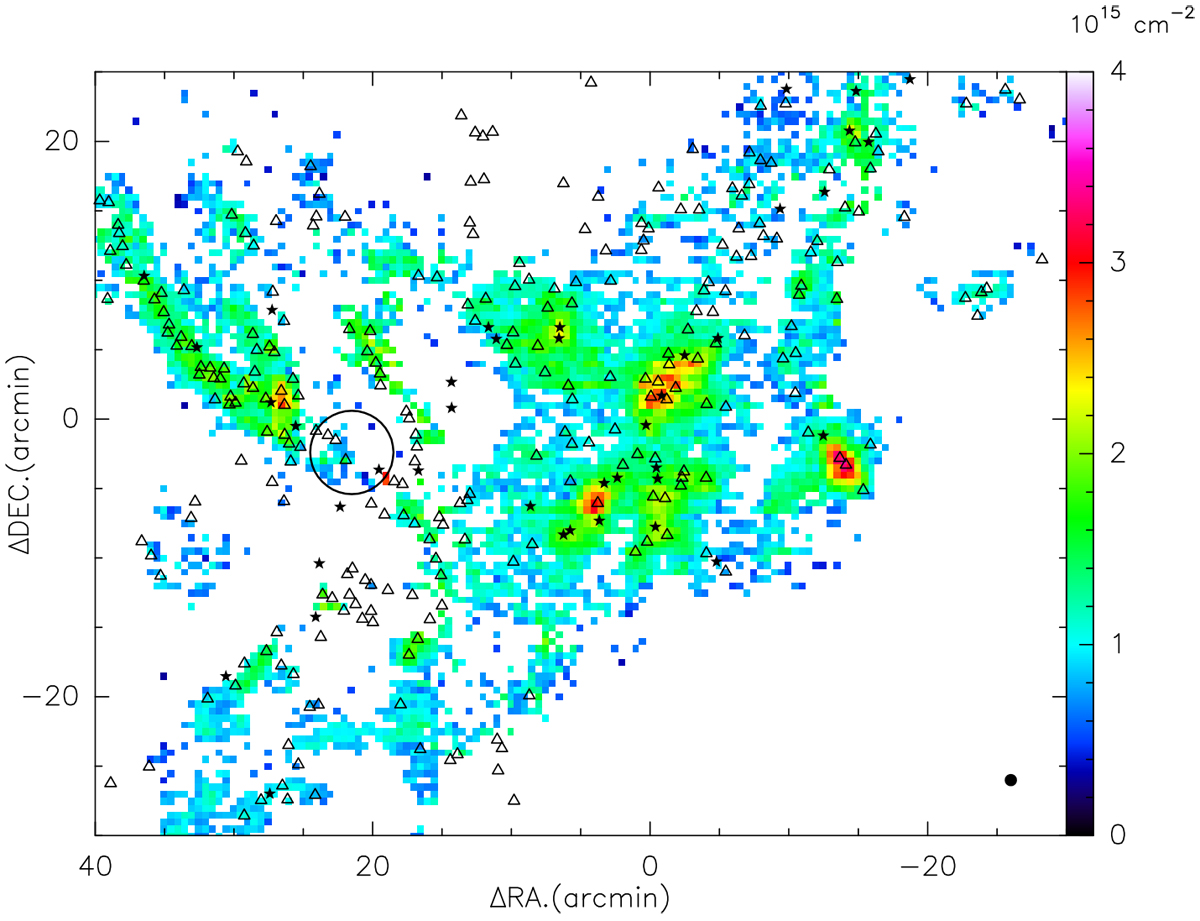
Map of the column density of C18O(1− 0). The black stars and triangles present the locations of protostellar and prestellar cores, respectively. The coordinates of the protostellar and prestellar cores were taken from Könyves et al. (2015). The black circle marks the location of the W 40 H II region (radius ∽ 3′) and the black filled circle in the bottom-right corner illustrates the beam size of 60′′. The clippinglevel for the 13CO and C18O data corresponds to a signal-to-noise ratio greater than five. Gaussian fitting to each pixel was done.
Current usage metrics show cumulative count of Article Views (full-text article views including HTML views, PDF and ePub downloads, according to the available data) and Abstracts Views on Vision4Press platform.
Data correspond to usage on the plateform after 2015. The current usage metrics is available 48-96 hours after online publication and is updated daily on week days.
Initial download of the metrics may take a while.