Fig. 10
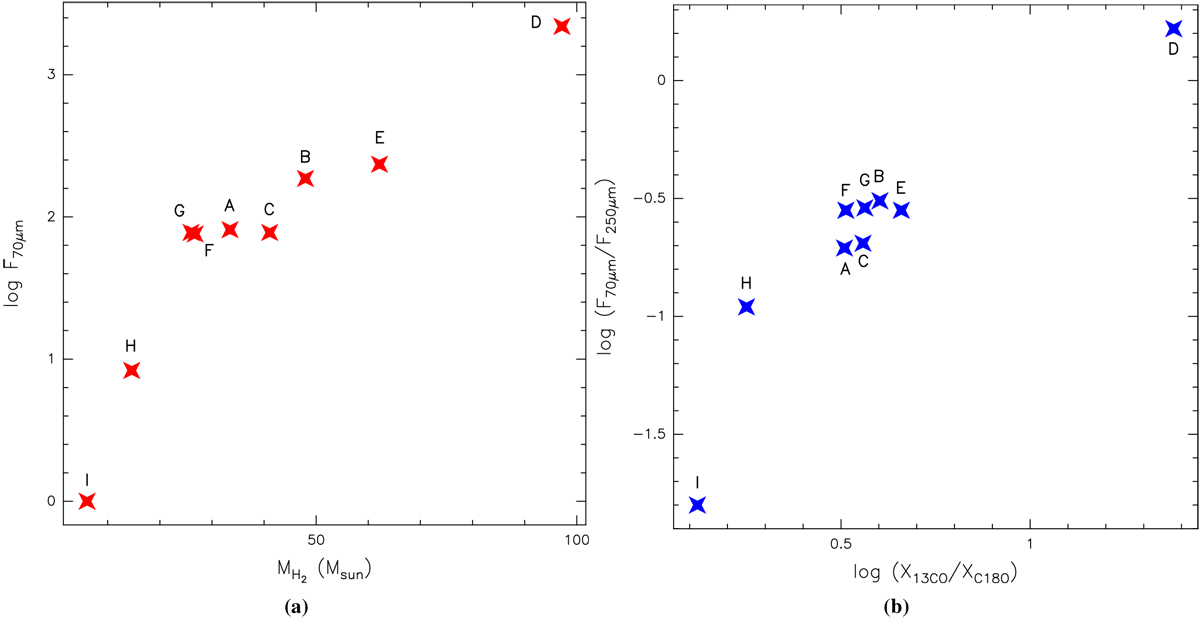
(a) Mass-corrected self-absorption vs. 70 μm flux, and (b) the ratio ![]() , equivalent tothe dissociation rate of the C18O, vs. the flux ratio F70μm∕F250μm
of the distinct regions. Selected regions are marked with the letters A to I. The average fluxes of the infrared 70 and 250
μm images of the distinct regions in both panels were obtained from the data of the Herschel Gould Belt Survey Archive.
, equivalent tothe dissociation rate of the C18O, vs. the flux ratio F70μm∕F250μm
of the distinct regions. Selected regions are marked with the letters A to I. The average fluxes of the infrared 70 and 250
μm images of the distinct regions in both panels were obtained from the data of the Herschel Gould Belt Survey Archive.
Current usage metrics show cumulative count of Article Views (full-text article views including HTML views, PDF and ePub downloads, according to the available data) and Abstracts Views on Vision4Press platform.
Data correspond to usage on the plateform after 2015. The current usage metrics is available 48-96 hours after online publication and is updated daily on week days.
Initial download of the metrics may take a while.