Fig. 7
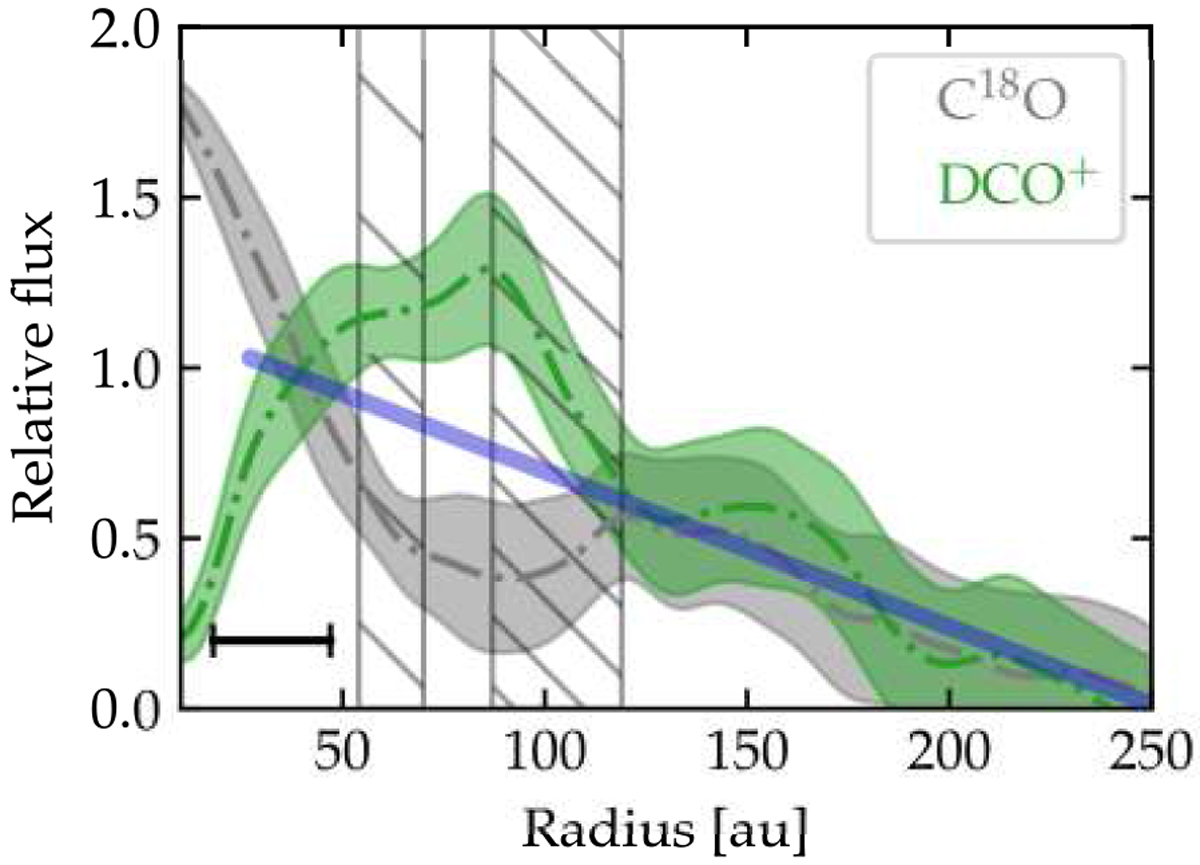
Azimuthally averaged profiles of DCO+ (green) and C18O (gray) emission line fluxes from Favre et al. (2019). The profiles were normalized to have the same slope outside of the gap (120–250 au); the slope is shown in blue. There is an increase in DCO+ emission anda decrease in C18O emission intensity at the gap location in comparison with it. In the bottom left corner of the image, the beam size of 0.23″ is shown. The locations of the gaps are shown by the hatched boxes.
Current usage metrics show cumulative count of Article Views (full-text article views including HTML views, PDF and ePub downloads, according to the available data) and Abstracts Views on Vision4Press platform.
Data correspond to usage on the plateform after 2015. The current usage metrics is available 48-96 hours after online publication and is updated daily on week days.
Initial download of the metrics may take a while.