Fig. 5
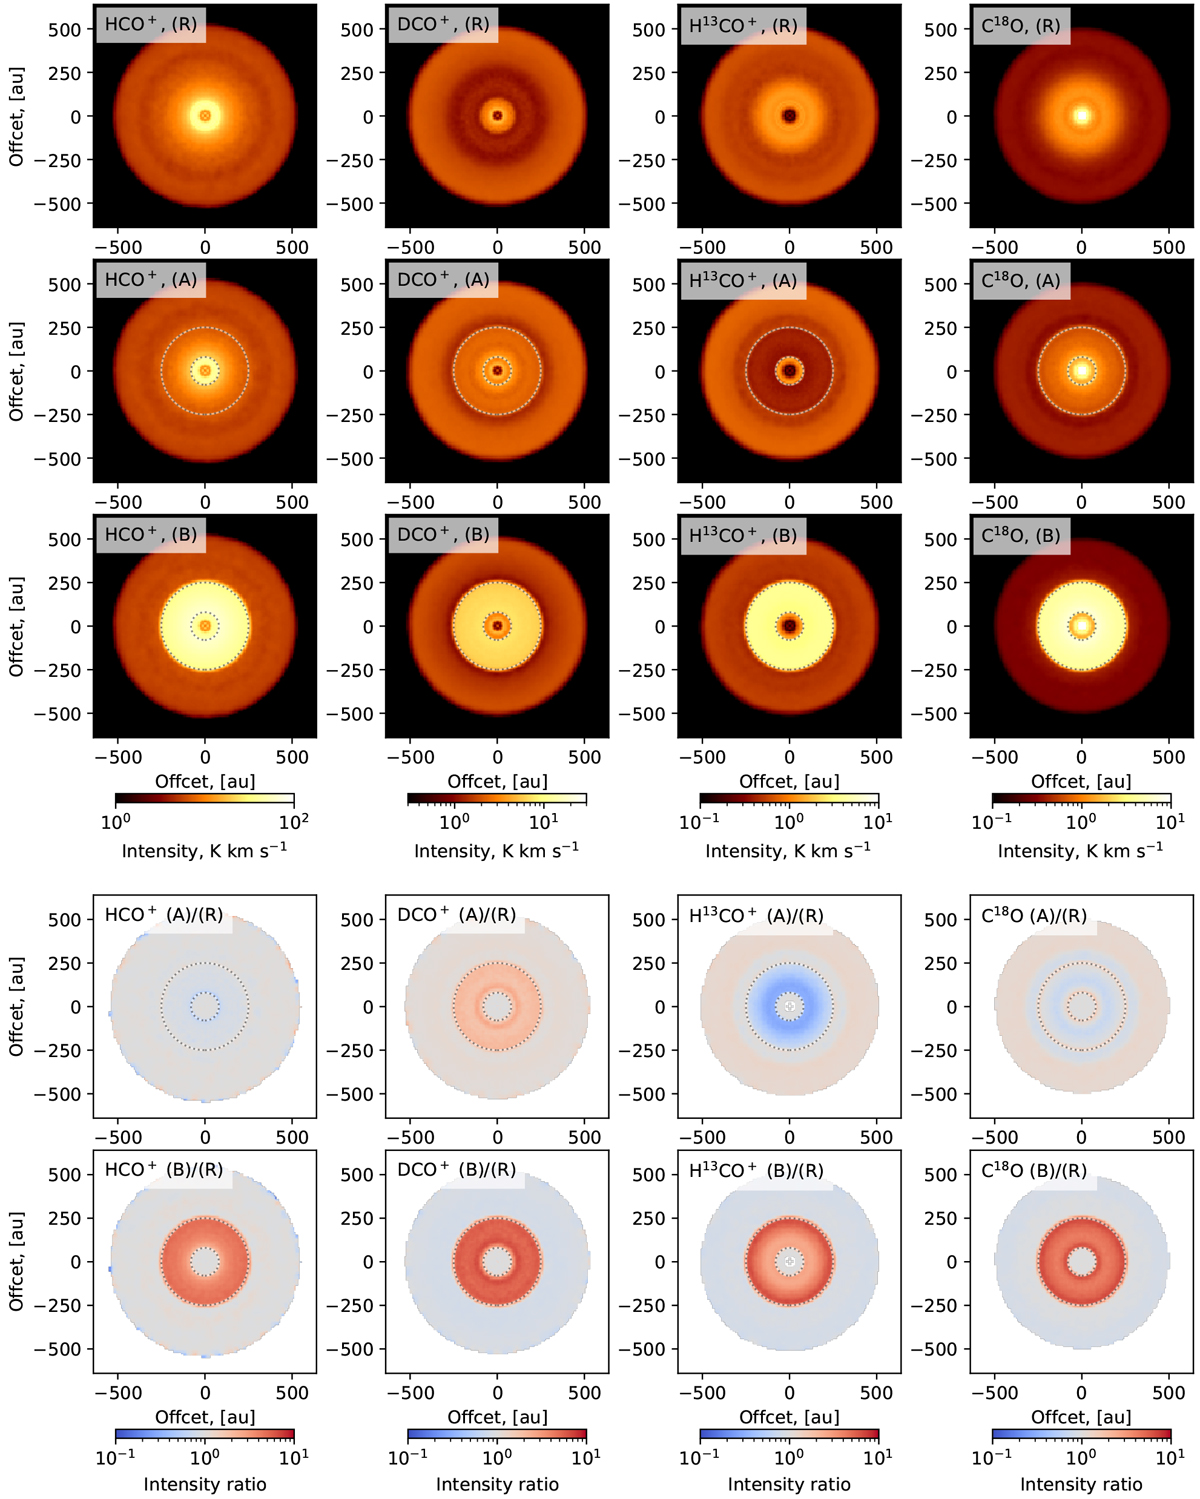
Integrated intensity 0th-moment maps. From left to right: HCO+, DCO+, H13CO+, and C18O, all J = 3–2. From the top to the bottom row: reference model (R), gas-poor gap model (A), gas-rich model (B), ratio (A)/(R), and ratio (B)/(R). The gap boundaries are marked by the two dotted lines. The optically thick HCO+ emission is not significantly affected by the presence of the gas-poor gap. In contrast, the C18O and particularly H13CO+ intensities decrease inside the gas-poor gap, while the DCO+ intensity increases inside this gap.
Current usage metrics show cumulative count of Article Views (full-text article views including HTML views, PDF and ePub downloads, according to the available data) and Abstracts Views on Vision4Press platform.
Data correspond to usage on the plateform after 2015. The current usage metrics is available 48-96 hours after online publication and is updated daily on week days.
Initial download of the metrics may take a while.