Fig. 4
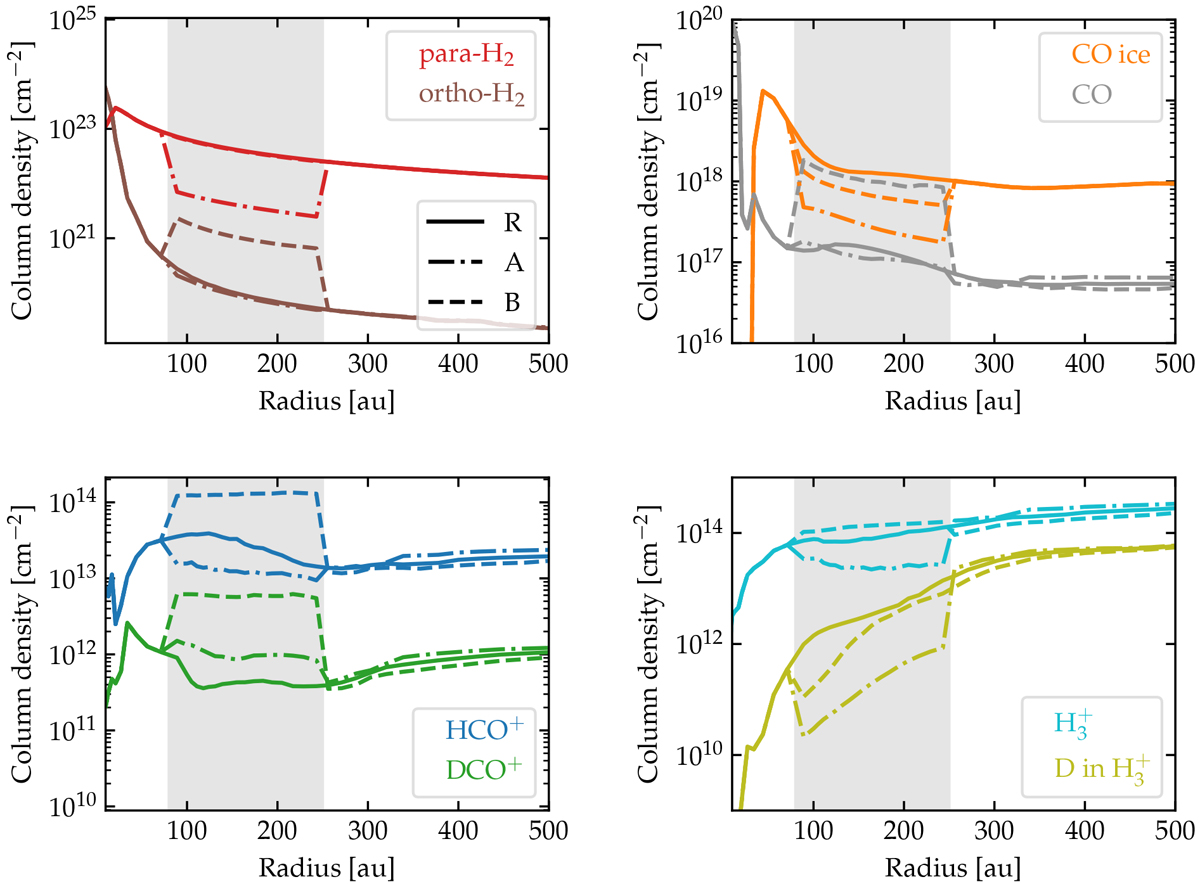
Radial profiles of the vertical column densities of the selected molecules. D in H![]() is the total number of D atoms in H
is the total number of D atoms in H![]() isotopologues. The solid lines correspond to the reference model (R), the dash-dotted lines to the gas-poor model (A), and the dashed lines to the gas-rich model (B). The location of the gap is shown by the gray rectangle.
isotopologues. The solid lines correspond to the reference model (R), the dash-dotted lines to the gas-poor model (A), and the dashed lines to the gas-rich model (B). The location of the gap is shown by the gray rectangle.
Current usage metrics show cumulative count of Article Views (full-text article views including HTML views, PDF and ePub downloads, according to the available data) and Abstracts Views on Vision4Press platform.
Data correspond to usage on the plateform after 2015. The current usage metrics is available 48-96 hours after online publication and is updated daily on week days.
Initial download of the metrics may take a while.