Fig. 3
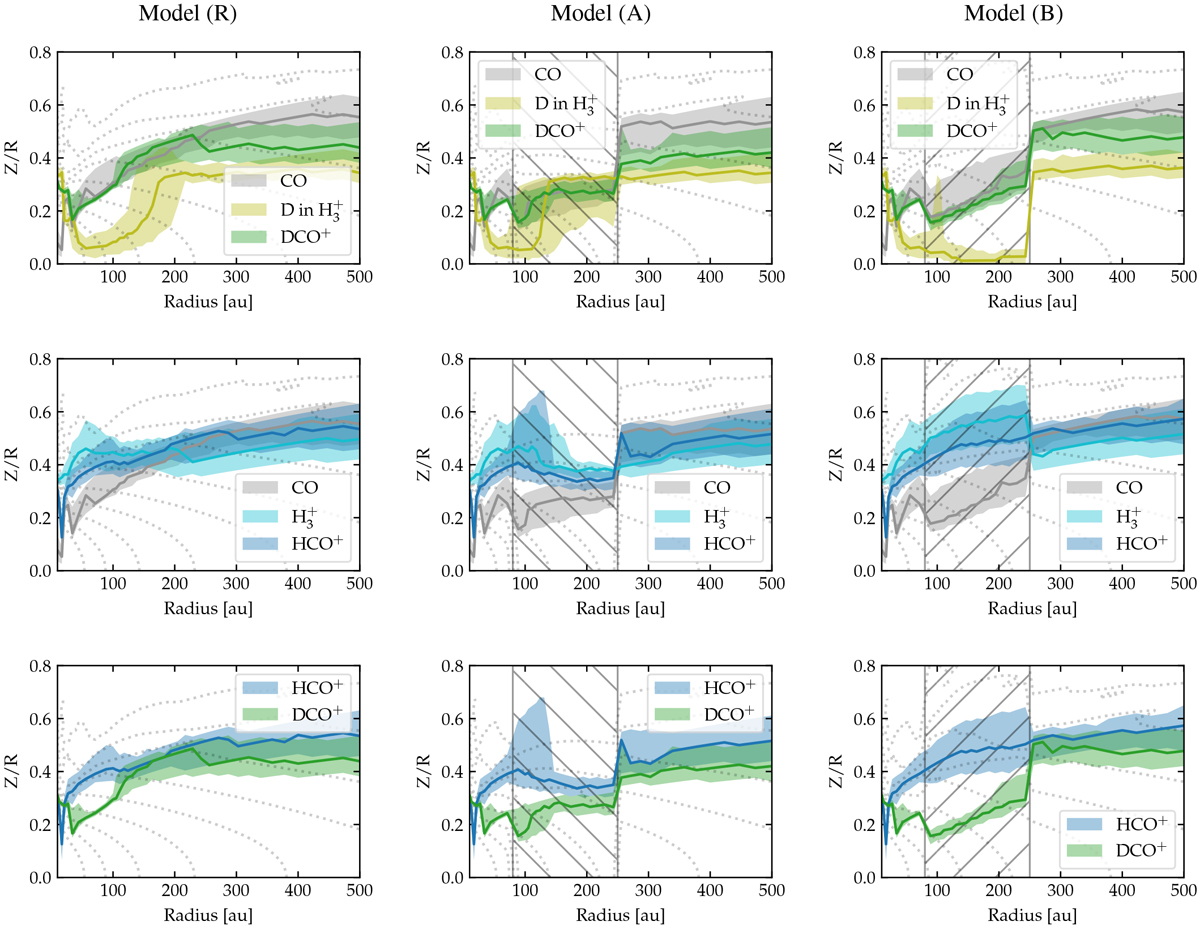
Vertical mass distribution of H![]() , deuterium inH
, deuterium inH![]() isotopologues, CO, HCO+, and DCO+ as a function of the radius. The color-filled stripes show the vertical location of the 25, 50, and 75 mass percentiles (bottom border, median line, and top border, respectively). Half of the total molecular gas mass is located within the corresponding stripe. The dotted contour lines show the gas isodensities from 1 × 10⁻¹⁸ to 1 × 10⁻¹⁴ g cm−3 with a logarithmic step of 100.5, which is thesame as in the top panel of Fig. 1. Left panel: reference model (R), middle panel: gas-poor gap model (A), and right panel: gas-rich gap model (B). The location of the gap is shown as a hatched background. When molecules are co-spatial, their mass distributions overlap (e.g., as in the case of deuterated isotopologues of H
isotopologues, CO, HCO+, and DCO+ as a function of the radius. The color-filled stripes show the vertical location of the 25, 50, and 75 mass percentiles (bottom border, median line, and top border, respectively). Half of the total molecular gas mass is located within the corresponding stripe. The dotted contour lines show the gas isodensities from 1 × 10⁻¹⁸ to 1 × 10⁻¹⁴ g cm−3 with a logarithmic step of 100.5, which is thesame as in the top panel of Fig. 1. Left panel: reference model (R), middle panel: gas-poor gap model (A), and right panel: gas-rich gap model (B). The location of the gap is shown as a hatched background. When molecules are co-spatial, their mass distributions overlap (e.g., as in the case of deuterated isotopologues of H![]() in the model (A)).
in the model (A)).
Current usage metrics show cumulative count of Article Views (full-text article views including HTML views, PDF and ePub downloads, according to the available data) and Abstracts Views on Vision4Press platform.
Data correspond to usage on the plateform after 2015. The current usage metrics is available 48-96 hours after online publication and is updated daily on week days.
Initial download of the metrics may take a while.