Fig. 1
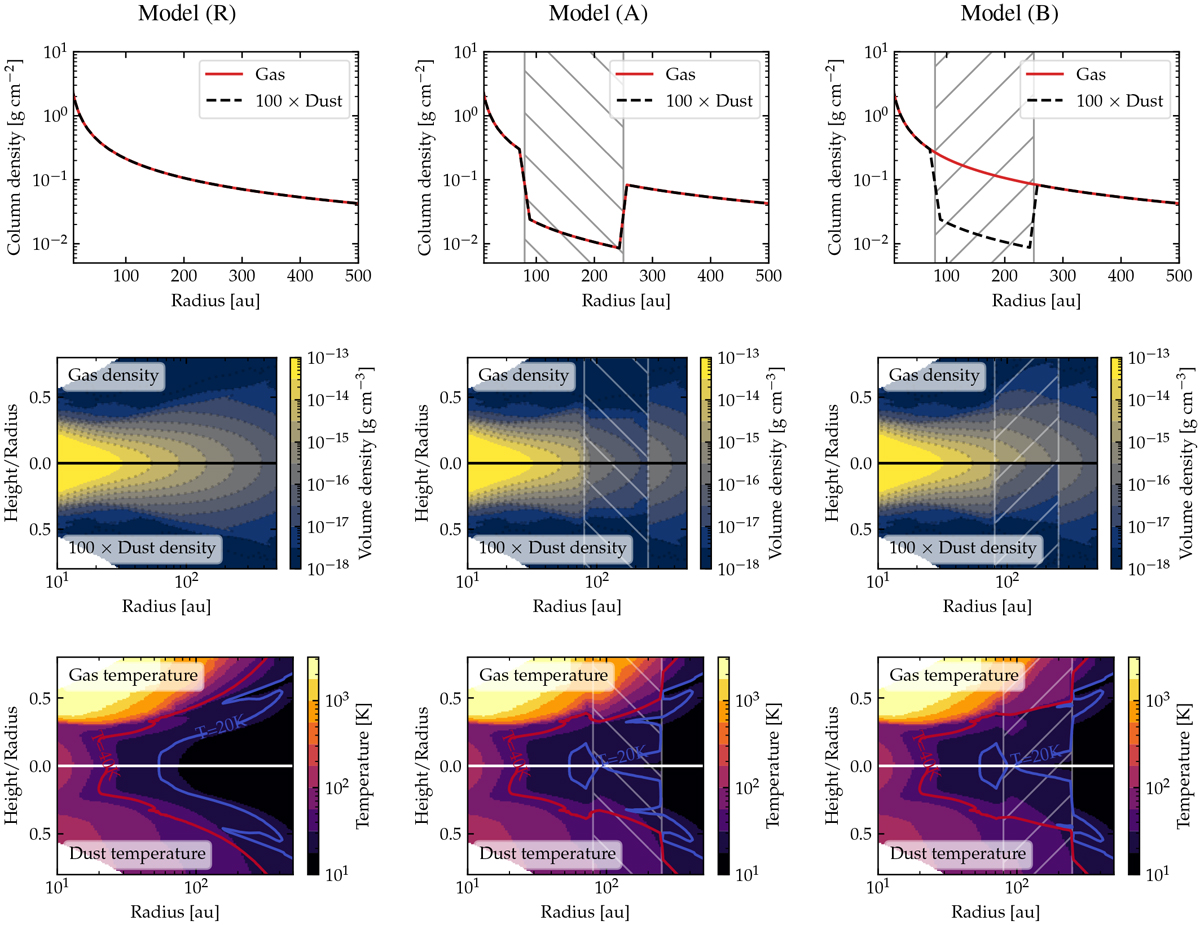
Physical structure of the three protoplanetary disk models. The left panels are for the reference model (R), the middle panels are for the gas-poor gap model (A), and the right panels are for the gas-rich gap model (B). Upper row: column densities of gas and dust. The dust column density is multiplied by 100 for comparison purposes with the gas and the typical dust-to-gas mass ratio of 0.01. Second row: the upper half of each panel is the gas density, and the bottom half is the dust density, multiplied by 100 for comparison. Bottom row: the upper half of each panel is the gas temperature, and the bottom half is the dust temperature. The location of the gap is marked by a hatched rectangle. The 20 and 40 K gas temperature isotherms are shown as blue and red contour lines, respectively.
Current usage metrics show cumulative count of Article Views (full-text article views including HTML views, PDF and ePub downloads, according to the available data) and Abstracts Views on Vision4Press platform.
Data correspond to usage on the plateform after 2015. The current usage metrics is available 48-96 hours after online publication and is updated daily on week days.
Initial download of the metrics may take a while.