Fig. A.2.
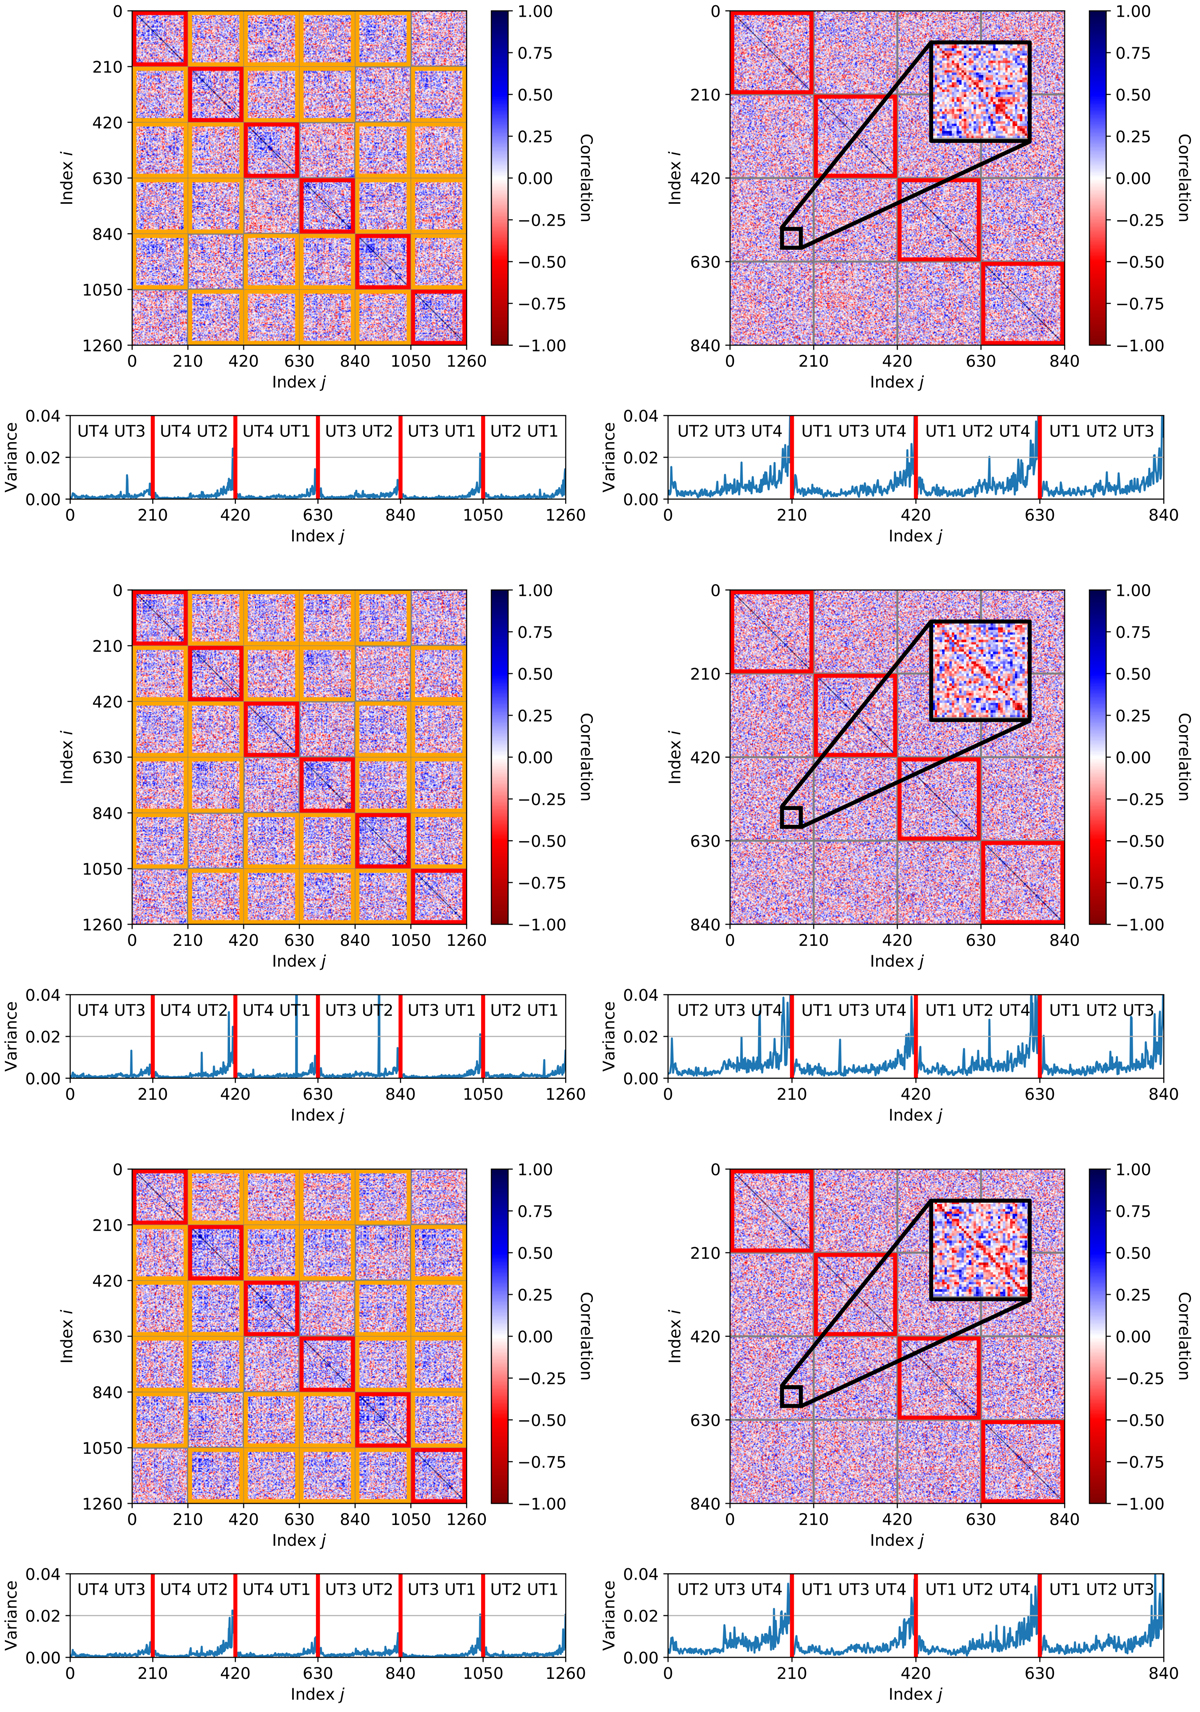
Same as Fig. 2, but showing the correlations of the VISAMP instead of the VIS2, extracted from the three P2VM-reduced files used for the injection and recovery tests with real data in Sect. 3.3 (programme 0101.C-0907(B)). From top to bottom: GRAVI.2018-04-18T08-08-19.739_singlescip2vmred.fits, GRAVI.2018-04-18T08-12-10.749_singlescip2vmred.fits, GRAVI.2018-04-18T08-20-04.769_singlescip2vmred.fits.
Current usage metrics show cumulative count of Article Views (full-text article views including HTML views, PDF and ePub downloads, according to the available data) and Abstracts Views on Vision4Press platform.
Data correspond to usage on the plateform after 2015. The current usage metrics is available 48-96 hours after online publication and is updated daily on week days.
Initial download of the metrics may take a while.