Fig. 7.
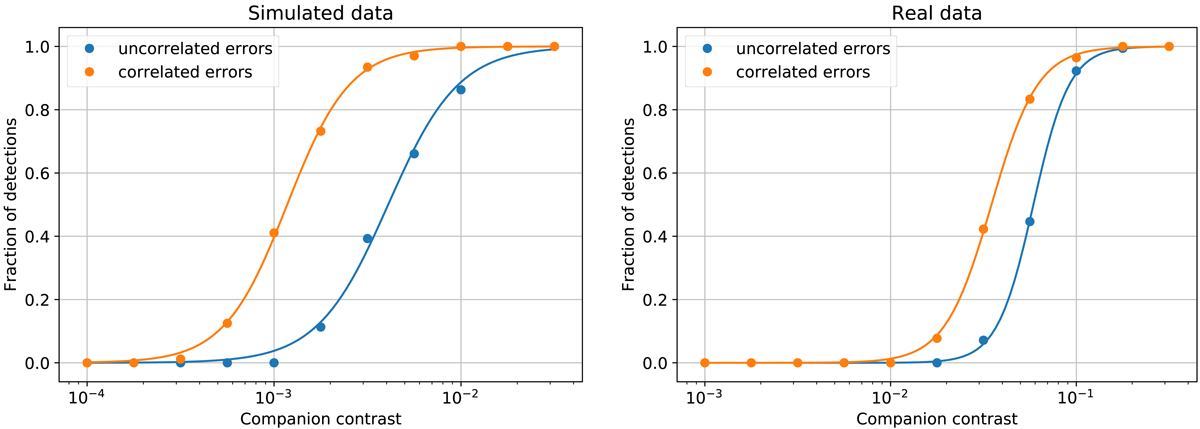
Left panel: fraction of correctly recovered companions as a function of the relative flux of the injected companion from injection and recovery tests with simulated GRAVITY data (cf. Sect. 3.2), assuming uncorrelated data (blue points) and correlated data (orange points) for the model fitting. The blue and the orange curves are logistic growth functions fitted to the data points. Right panel: same, but from injection and recovery tests with real GRAVITY data (cf. Sect. 3.3).
Current usage metrics show cumulative count of Article Views (full-text article views including HTML views, PDF and ePub downloads, according to the available data) and Abstracts Views on Vision4Press platform.
Data correspond to usage on the plateform after 2015. The current usage metrics is available 48-96 hours after online publication and is updated daily on week days.
Initial download of the metrics may take a while.