Fig. 3.
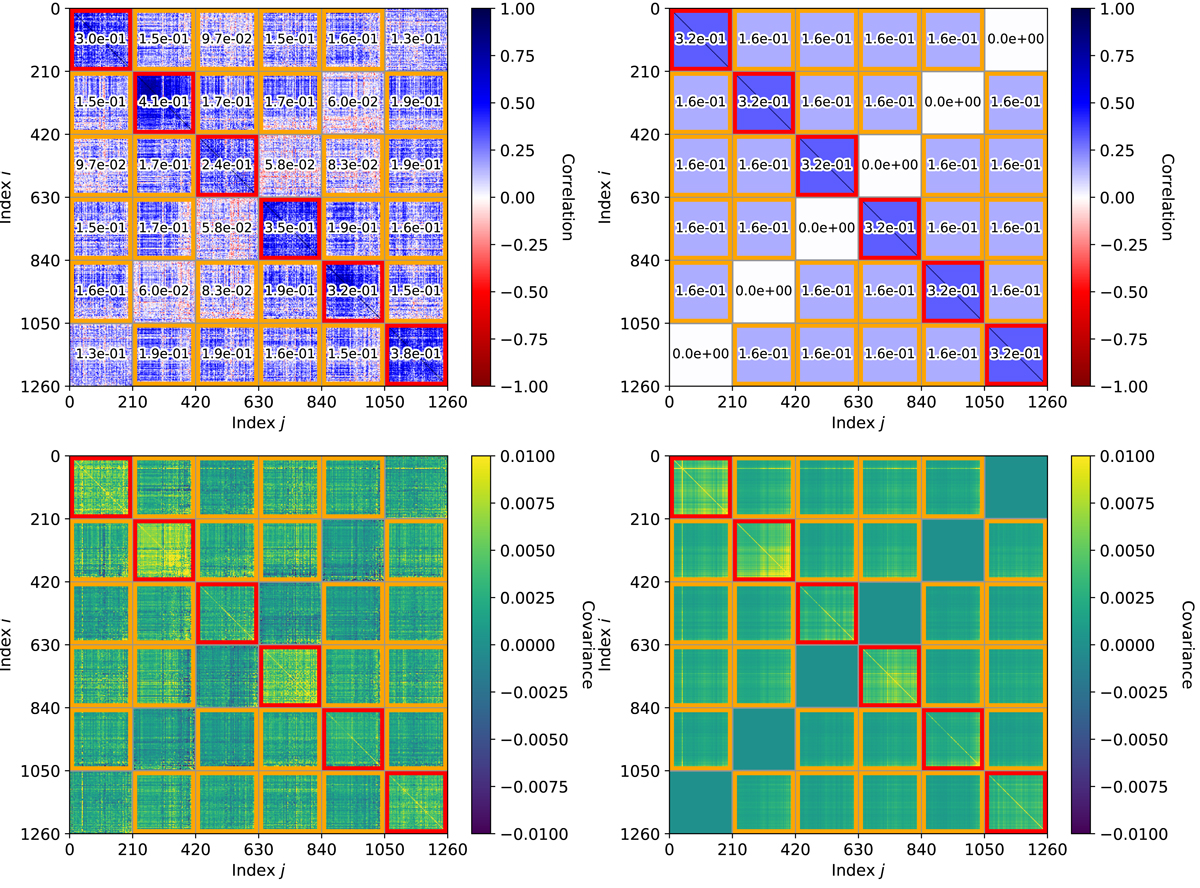
Correlations of the VIS2 for the GRAVITY science camera, extracted from a single P2VM-reduced file (upper left panel) and our one-parameter model fitted to them (upper right panel). The bottom panels show the corresponding covariances obtained by multiplying the correlation Cij with the product of the standard deviations σiσj. Correlations/covariances within the same baseline are highlighted with red squares and correlations/covariances between baselines having a telescope in common are highlighted with orange squares.
Current usage metrics show cumulative count of Article Views (full-text article views including HTML views, PDF and ePub downloads, according to the available data) and Abstracts Views on Vision4Press platform.
Data correspond to usage on the plateform after 2015. The current usage metrics is available 48-96 hours after online publication and is updated daily on week days.
Initial download of the metrics may take a while.