Fig. C.1.
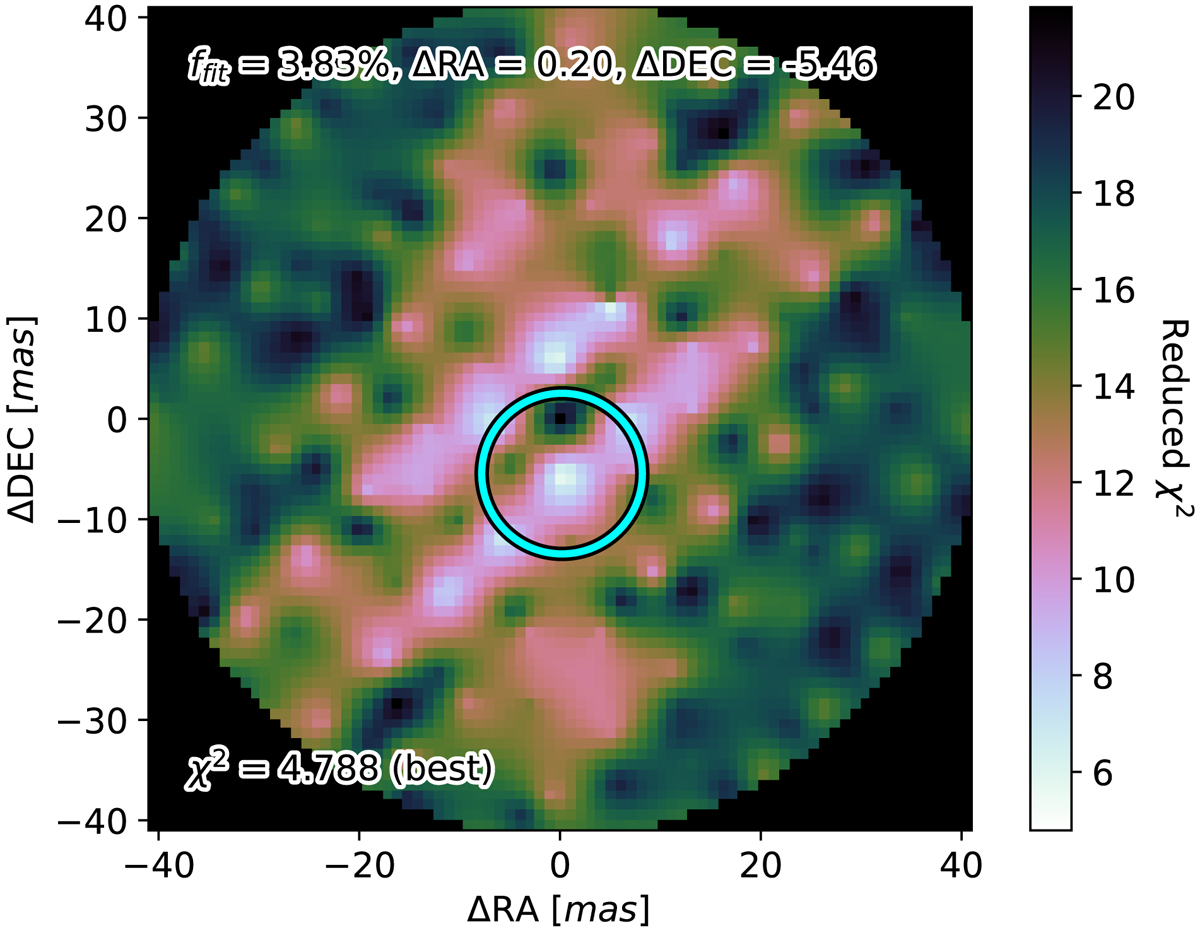
Detection map for the GRAVITY data used for the injection and recovery tests in Sect. 3.3. The host star is located in the centre of the map and the cyan circle highlights the position of the best fit companion. Its parameters and reduced chi-squared are shown at the top and the bottom of the map. North is up and east is left.
Current usage metrics show cumulative count of Article Views (full-text article views including HTML views, PDF and ePub downloads, according to the available data) and Abstracts Views on Vision4Press platform.
Data correspond to usage on the plateform after 2015. The current usage metrics is available 48-96 hours after online publication and is updated daily on week days.
Initial download of the metrics may take a while.