Fig. 1.
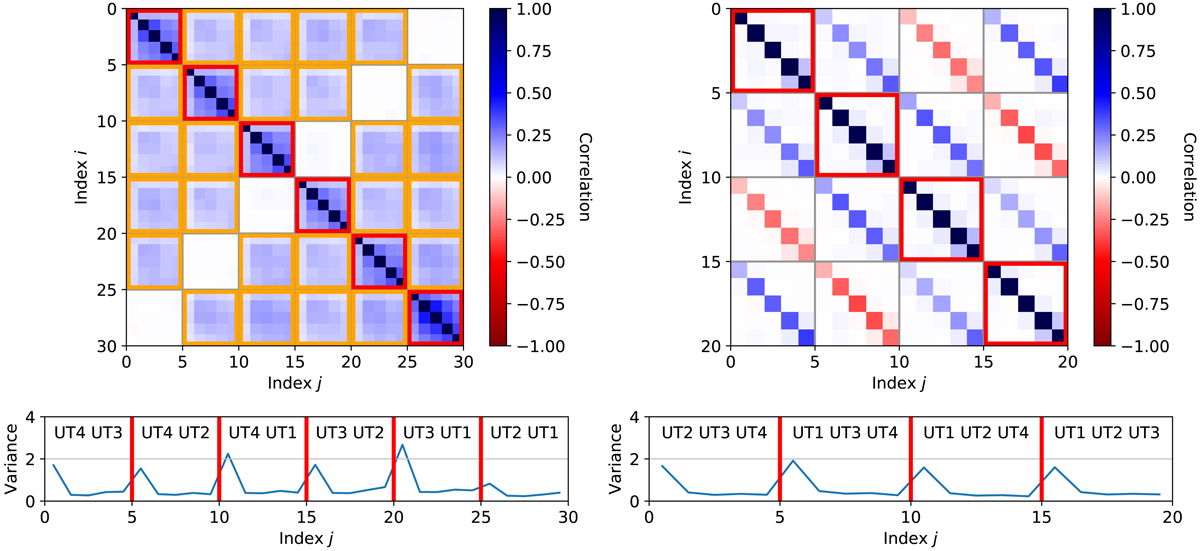
Correlations of the VIS2 (left panel) and the T3 (right panel) for the GRAVITY fringe tracker, extracted from a single P2VM-reduced file. The axes run over the different baselines/triangles, with each individual baseline/triangle comprising five spectral channels. Correlations within the same baseline/triangle are highlighted with red squares and correlations between baselines having a telescope in common are highlighted with orange squares. We note that the correlations are computed from 46 592 individual measurements. Below each panel, the variance of the data and the names of the telescopes forming each baseline/triangle are shown.
Current usage metrics show cumulative count of Article Views (full-text article views including HTML views, PDF and ePub downloads, according to the available data) and Abstracts Views on Vision4Press platform.
Data correspond to usage on the plateform after 2015. The current usage metrics is available 48-96 hours after online publication and is updated daily on week days.
Initial download of the metrics may take a while.