Fig. A.1.
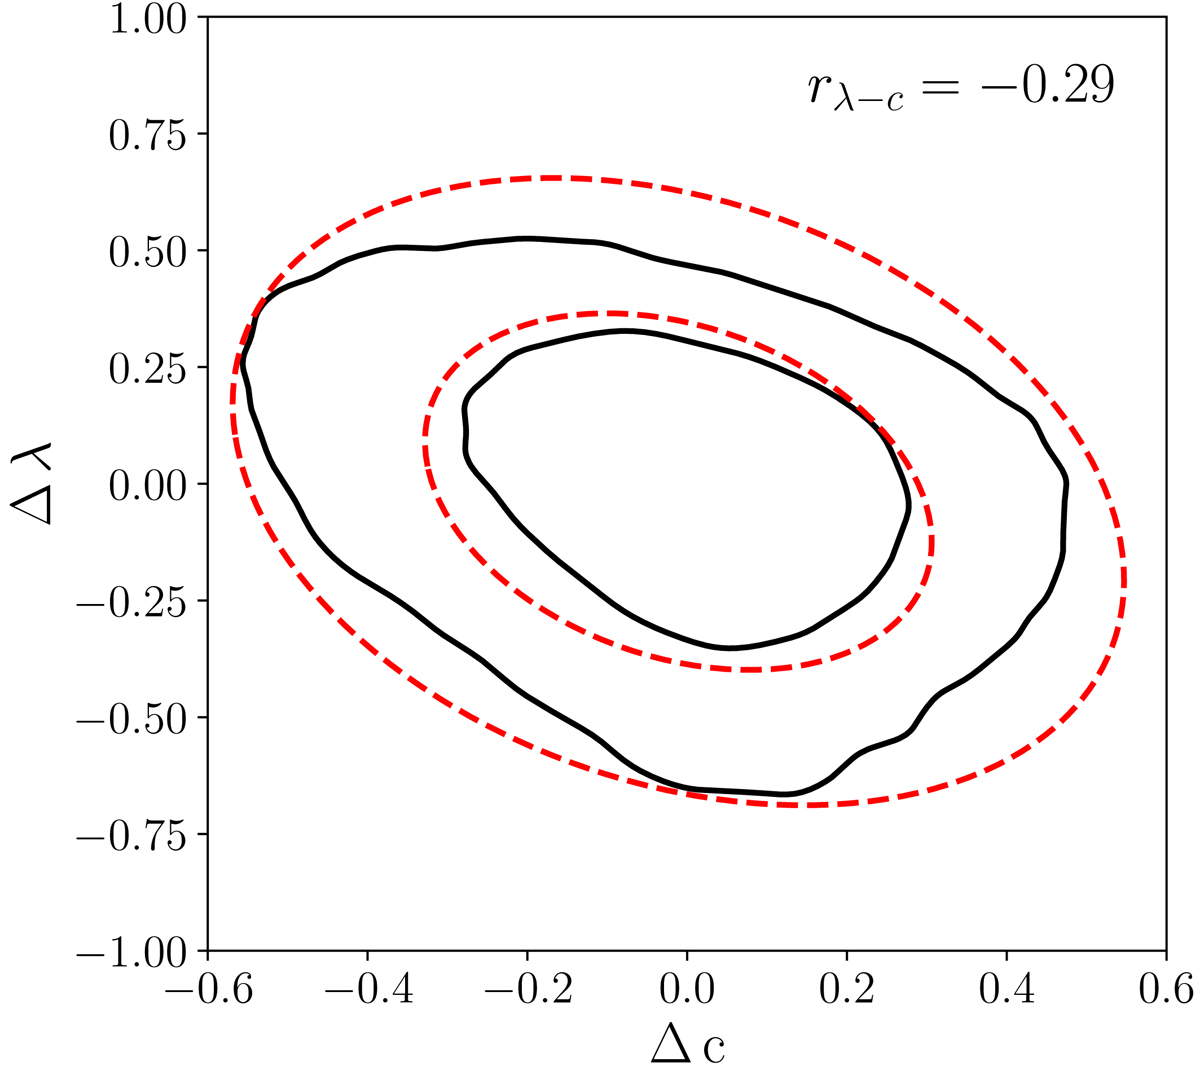
Correlation between the λ and c residuals at a fixed halo virial mass, for the z = 0 halo population in the Bolshoi-Planck simulation, represented with the black solid contours (containing 68%−95% of the halo population). The red dashed contours are the 1- and 2-σ contours of the 2D normal distribution defined with the covariance matrix calculated from the distribution of points in this plane.
Current usage metrics show cumulative count of Article Views (full-text article views including HTML views, PDF and ePub downloads, according to the available data) and Abstracts Views on Vision4Press platform.
Data correspond to usage on the plateform after 2015. The current usage metrics is available 48-96 hours after online publication and is updated daily on week days.
Initial download of the metrics may take a while.