Fig. 5.
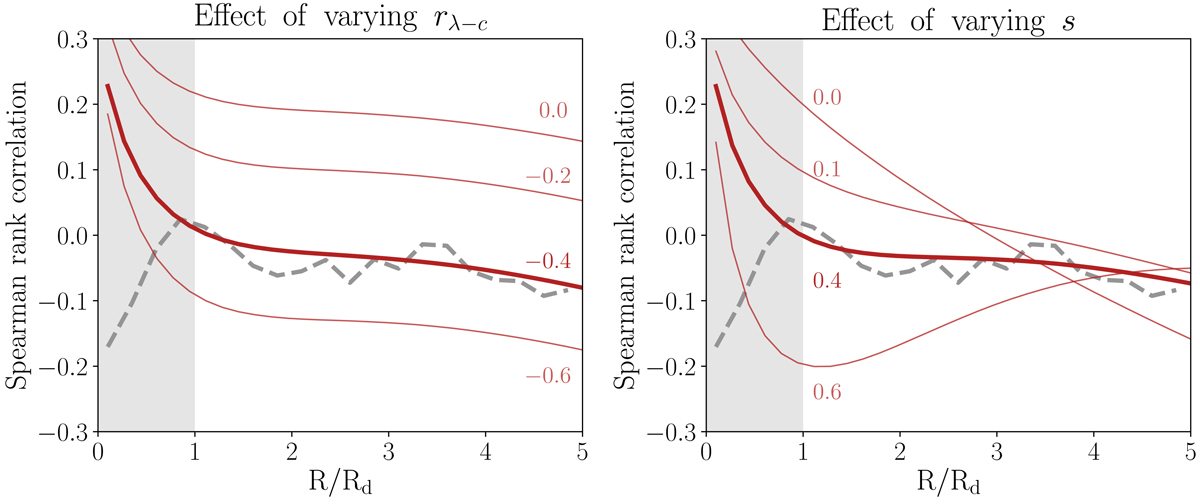
Effect of changing the correlation coefficient between halo spin and concentration rλ − c (left) and the slope of the relation between the stellar angular momentum fraction and the stellar mass fraction s (right) on the correlation of the TF and MS residuals as a function of the radius where the TF velocity was measured. The grey dashed curve shows the data from the SPARC sample, while the different red curves are models with different values of such parameters. In both panels, the thick red curve is our fiducial model (shown also in Figs. 1 and 2) with rλ − c = −0.4 and s = 0.4; while we fixed s = 0.4 in the left panel and rλ − c = −0.4 in the right panel. The grey area marks the region where the predictions of our model are not reliable, since we do not include a bulge component in our galaxies.
Current usage metrics show cumulative count of Article Views (full-text article views including HTML views, PDF and ePub downloads, according to the available data) and Abstracts Views on Vision4Press platform.
Data correspond to usage on the plateform after 2015. The current usage metrics is available 48-96 hours after online publication and is updated daily on week days.
Initial download of the metrics may take a while.