Fig. 2.
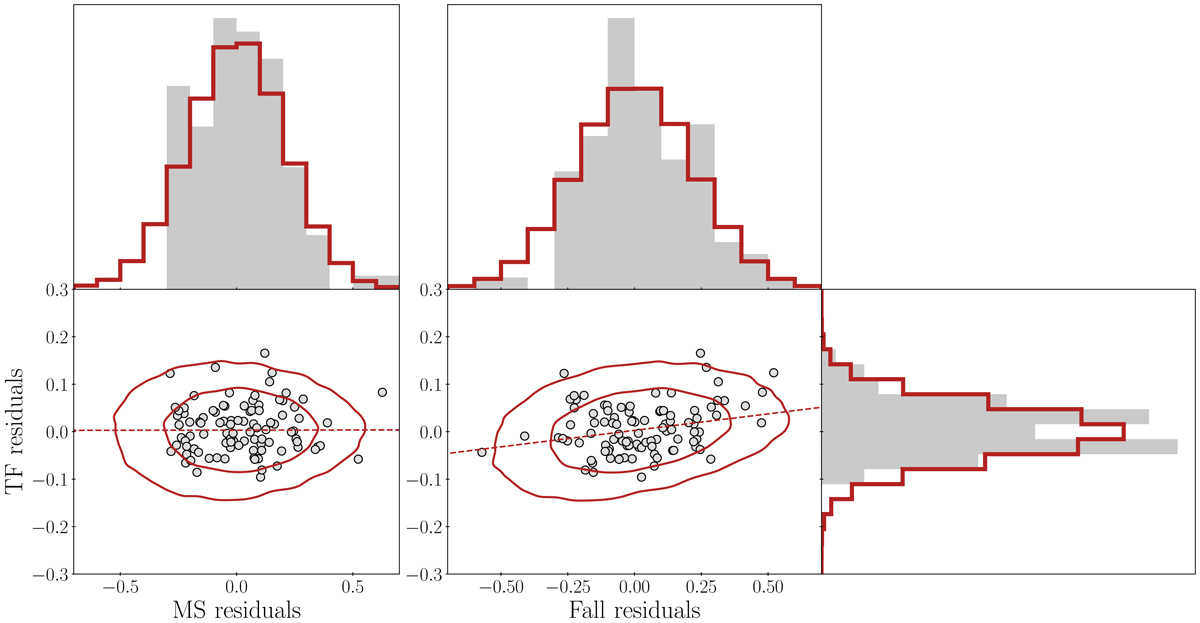
Residuals of the Tully–Fisher vs. mass-size (left) and of the Tully–Fisher vs. Fall relation (right). Data from SPARC are shown as grey circles, while the red curves are the 1- and 2-σ contours of the predicted galaxy distribution of the same model as in Fig. 1. The dashed line shows the slope of the correlation of the model. The histograms on top and on the right show the marginalised distributions of the respective residuals for the data (grey filled) and the model (red empty), respectively.
Current usage metrics show cumulative count of Article Views (full-text article views including HTML views, PDF and ePub downloads, according to the available data) and Abstracts Views on Vision4Press platform.
Data correspond to usage on the plateform after 2015. The current usage metrics is available 48-96 hours after online publication and is updated daily on week days.
Initial download of the metrics may take a while.