Fig. 1.
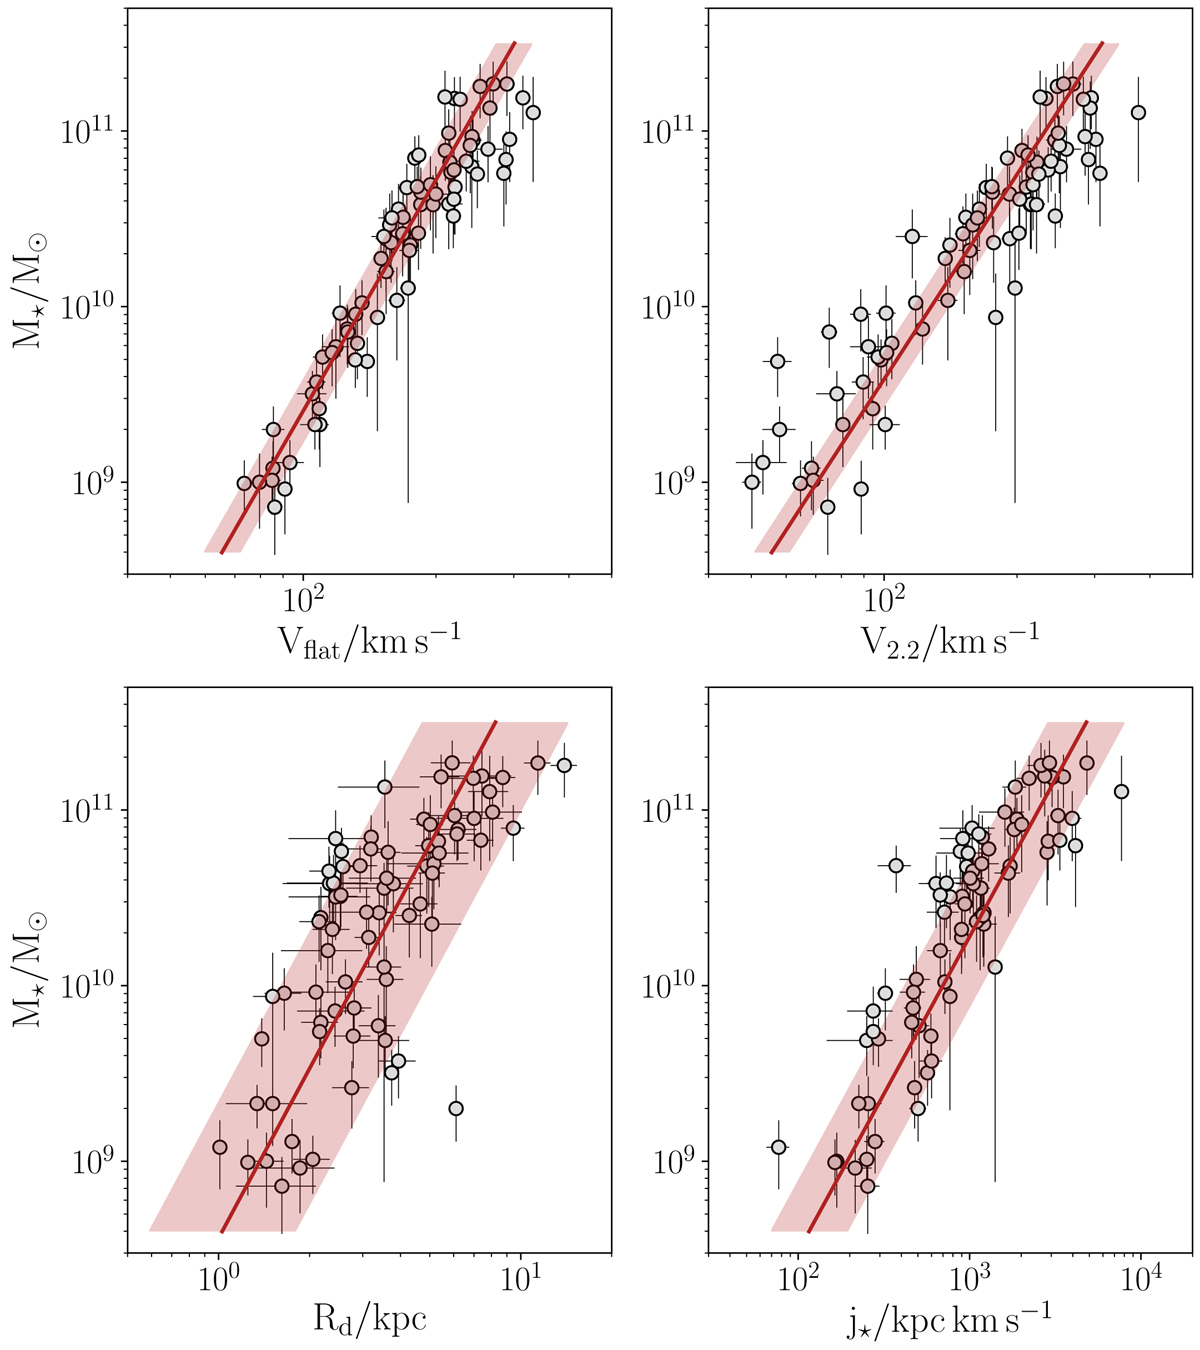
Comparison of the predictions of the model with rλ − c = −0.4 and s = 0.4 (red lines) against the observations from the SPARC catalogue (grey circles). We adopt two different velocity definitions for the TF relation: V2.2, the circular velocity at 2.2Rd, and Vflat, which we compare with Vc(5Rd) where our model rotation curves are approximately flat. The light red band shows the 1σ intrinsic scatter of the model.
Current usage metrics show cumulative count of Article Views (full-text article views including HTML views, PDF and ePub downloads, according to the available data) and Abstracts Views on Vision4Press platform.
Data correspond to usage on the plateform after 2015. The current usage metrics is available 48-96 hours after online publication and is updated daily on week days.
Initial download of the metrics may take a while.