Fig. 8
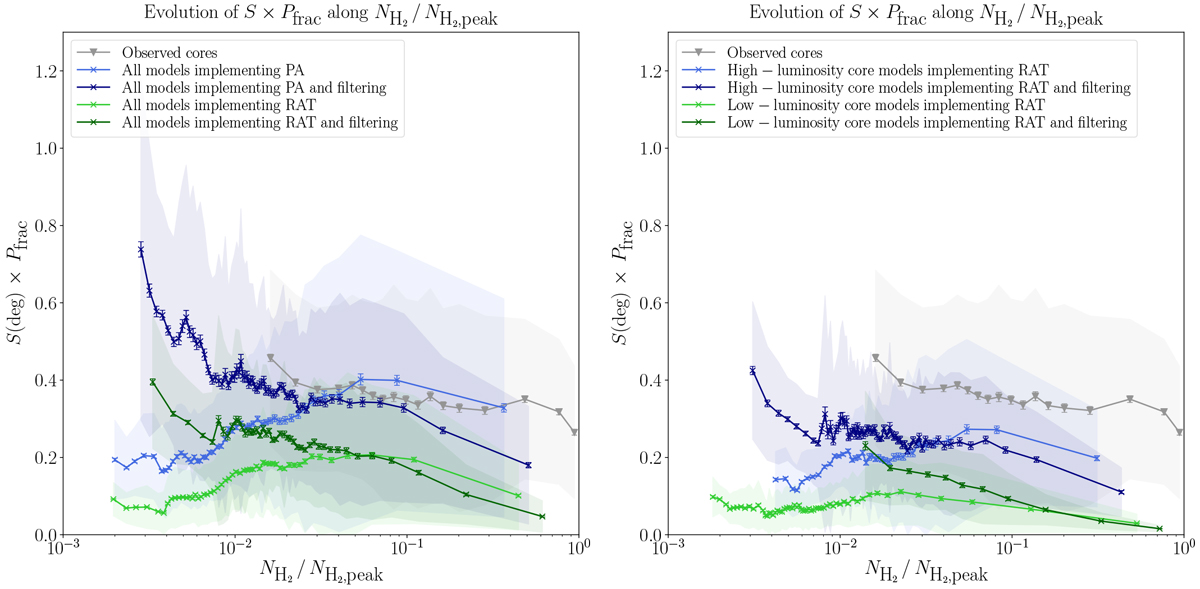
Observed distributions of the mean values of ![]() as a functionof the column density
as a functionof the column density ![]() (normalized by its maximum value,
(normalized by its maximum value, ![]() ) of all the ALMA cores (triangles) and of all the models (crosses). Left: the four lines representing the simulations correspond to results from all the simulations merged together, using RATs or PA, both filtered and not filtered. Right: we focus onthe simulations implementing RATs only, both filtered and not filtered, separating the three simulations with low protostellar accretion luminosity from the three with high accretion luminosity. The shaded areas represent
± the standard deviation of the Gaussian fit performed on each bin of points. The error bars correspond to these standard deviation values divided by the square root of the number of points in each bin.
) of all the ALMA cores (triangles) and of all the models (crosses). Left: the four lines representing the simulations correspond to results from all the simulations merged together, using RATs or PA, both filtered and not filtered. Right: we focus onthe simulations implementing RATs only, both filtered and not filtered, separating the three simulations with low protostellar accretion luminosity from the three with high accretion luminosity. The shaded areas represent
± the standard deviation of the Gaussian fit performed on each bin of points. The error bars correspond to these standard deviation values divided by the square root of the number of points in each bin.
Current usage metrics show cumulative count of Article Views (full-text article views including HTML views, PDF and ePub downloads, according to the available data) and Abstracts Views on Vision4Press platform.
Data correspond to usage on the plateform after 2015. The current usage metrics is available 48-96 hours after online publication and is updated daily on week days.
Initial download of the metrics may take a while.