Fig. 7
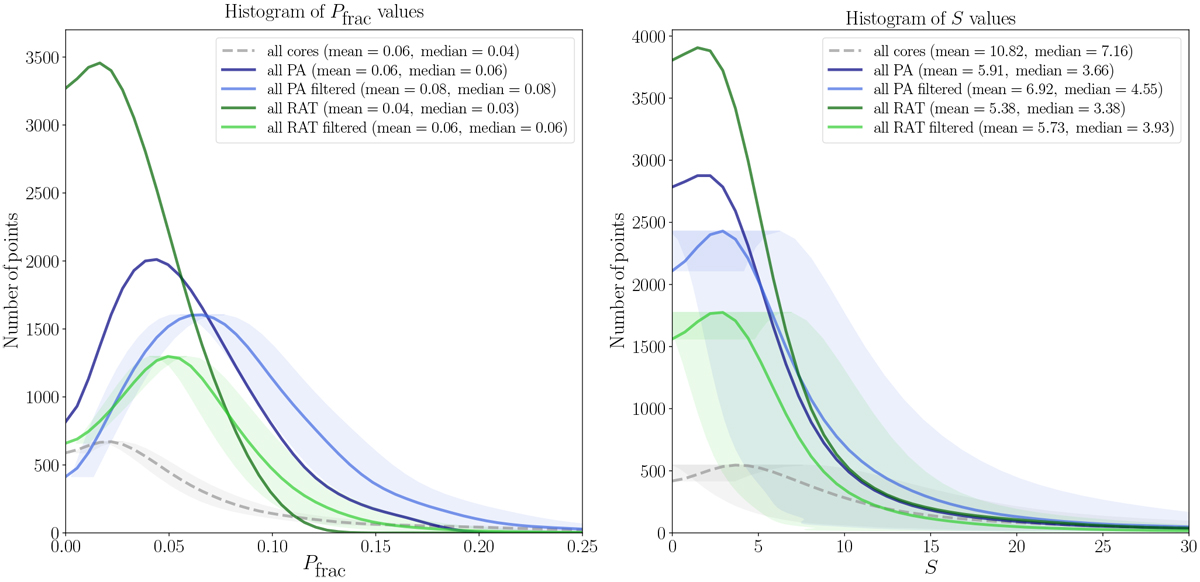
Histograms of polarization fraction ![]() (left) and dispersion of polarization angles
(left) and dispersion of polarization angles ![]() (right) for all ALMA cores (dashed lines), and for all simulations (solid lines; with grain alignment via perfect alignment [PA] or radiative torques [RATs], and with or without filtering). The histogram lines have been smoothed with a 1D-Gaussian kernel of a size of 0.2% in
(right) for all ALMA cores (dashed lines), and for all simulations (solid lines; with grain alignment via perfect alignment [PA] or radiative torques [RATs], and with or without filtering). The histogram lines have been smoothed with a 1D-Gaussian kernel of a size of 0.2% in ![]() and 2°
in
and 2°
in ![]() . In both panels, the shaded areas correspond to the mean of the uncertainty in
. In both panels, the shaded areas correspond to the mean of the uncertainty in
![]() and
and ![]() within each bin of the histogram. Right panel: we do plot the errors in
within each bin of the histogram. Right panel: we do plot the errors in
![]() , derived following Alina et al. (2016). We do not show uncertainties for the synthetically observed simulations, as they have not been filtered by the CASA simulator.
, derived following Alina et al. (2016). We do not show uncertainties for the synthetically observed simulations, as they have not been filtered by the CASA simulator.
Current usage metrics show cumulative count of Article Views (full-text article views including HTML views, PDF and ePub downloads, according to the available data) and Abstracts Views on Vision4Press platform.
Data correspond to usage on the plateform after 2015. The current usage metrics is available 48-96 hours after online publication and is updated daily on week days.
Initial download of the metrics may take a while.