Fig. 5
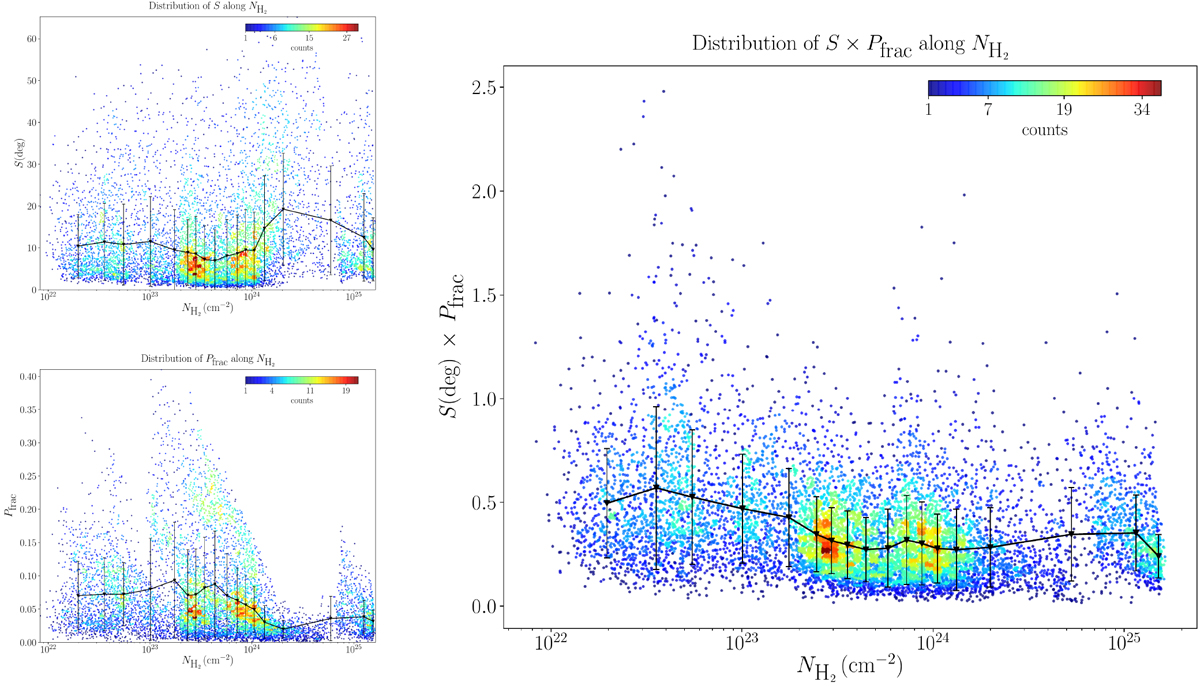
Distributions of the dispersion of polarization position angles ![]() (top left), the polarization fraction
(top left), the polarization fraction ![]() (bottom left), and
(bottom left), and ![]() (right), as a function of the column density
(right), as a function of the column density ![]() , where the data from all the cores are merged. The color scale represents number density of points in the plots. The solid black line and black points represent the running mean of
, where the data from all the cores are merged. The color scale represents number density of points in the plots. The solid black line and black points represent the running mean of
![]() ,
,
![]() , and
, and ![]() ; the associated black error bars are ± the standard deviation of each bin.
; the associated black error bars are ± the standard deviation of each bin.
Current usage metrics show cumulative count of Article Views (full-text article views including HTML views, PDF and ePub downloads, according to the available data) and Abstracts Views on Vision4Press platform.
Data correspond to usage on the plateform after 2015. The current usage metrics is available 48-96 hours after online publication and is updated daily on week days.
Initial download of the metrics may take a while.