Fig. 3
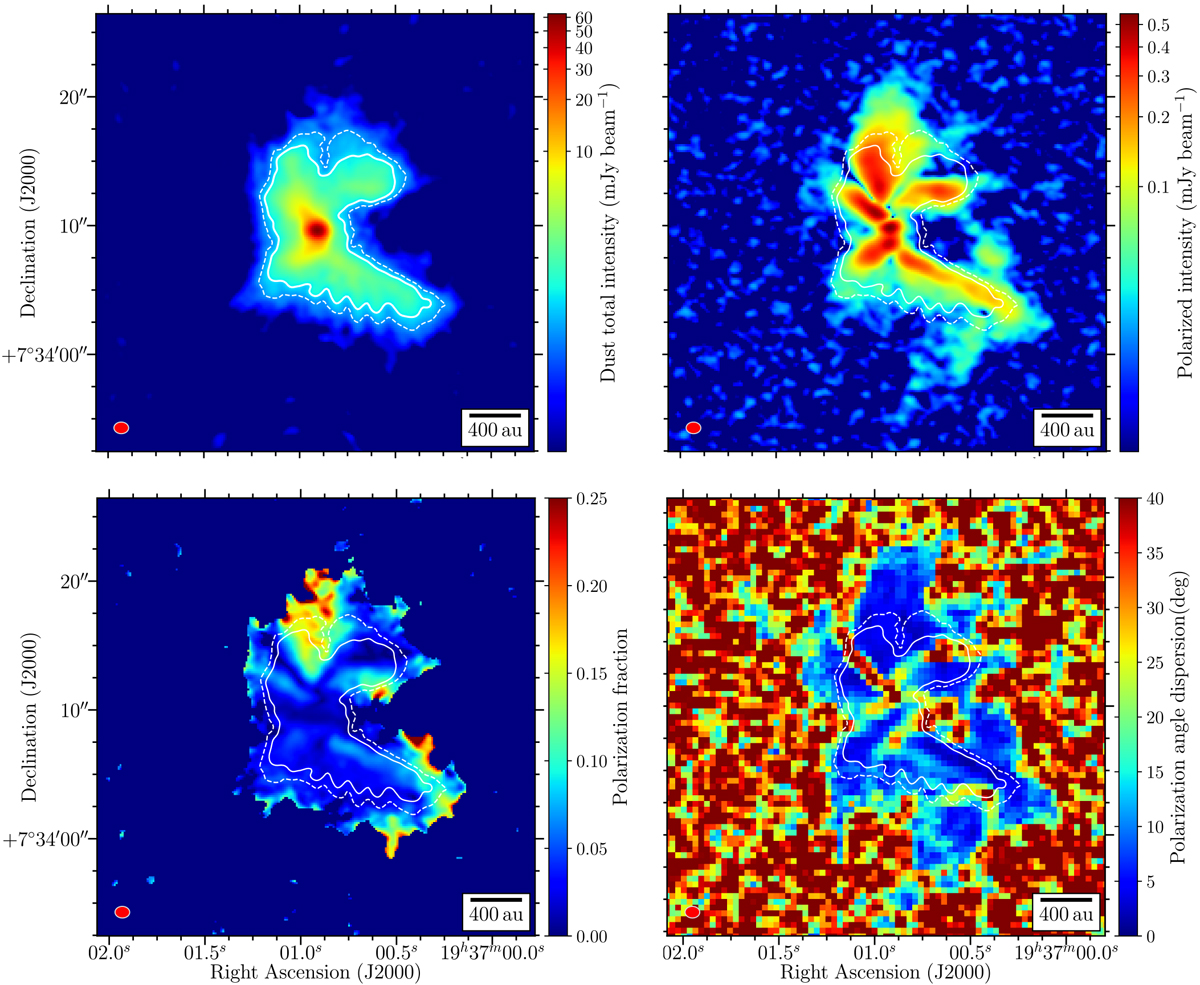
Maps from the 1.3 mm observations of the B335 core. Top left: total intensity (Stokes I) thermal dustemission in color scale. The emission is shown from 3σI where σI is the rms noise in the Stokes I map. Top right: polarized intensity P in colorscale.Bottom left: polarization fraction ![]() in colorscale,shown where I > 3σI.
Bottom right: dispersion
in colorscale,shown where I > 3σI.
Bottom right: dispersion ![]() of polarization position angles in color scale; the pixel size corresponds to the pixel size considered in the statistics. The dashed white contour represents the 5σI level. The solid white contour represents the threshold level of Stokes I calculated as described in Sect. 3.1, above which the mean S/N of P > 5. The beam size is 1.′′14 × 0.′′ 90, with a position angle of 89.1°.
of polarization position angles in color scale; the pixel size corresponds to the pixel size considered in the statistics. The dashed white contour represents the 5σI level. The solid white contour represents the threshold level of Stokes I calculated as described in Sect. 3.1, above which the mean S/N of P > 5. The beam size is 1.′′14 × 0.′′ 90, with a position angle of 89.1°.
Current usage metrics show cumulative count of Article Views (full-text article views including HTML views, PDF and ePub downloads, according to the available data) and Abstracts Views on Vision4Press platform.
Data correspond to usage on the plateform after 2015. The current usage metrics is available 48-96 hours after online publication and is updated daily on week days.
Initial download of the metrics may take a while.