Fig. 2
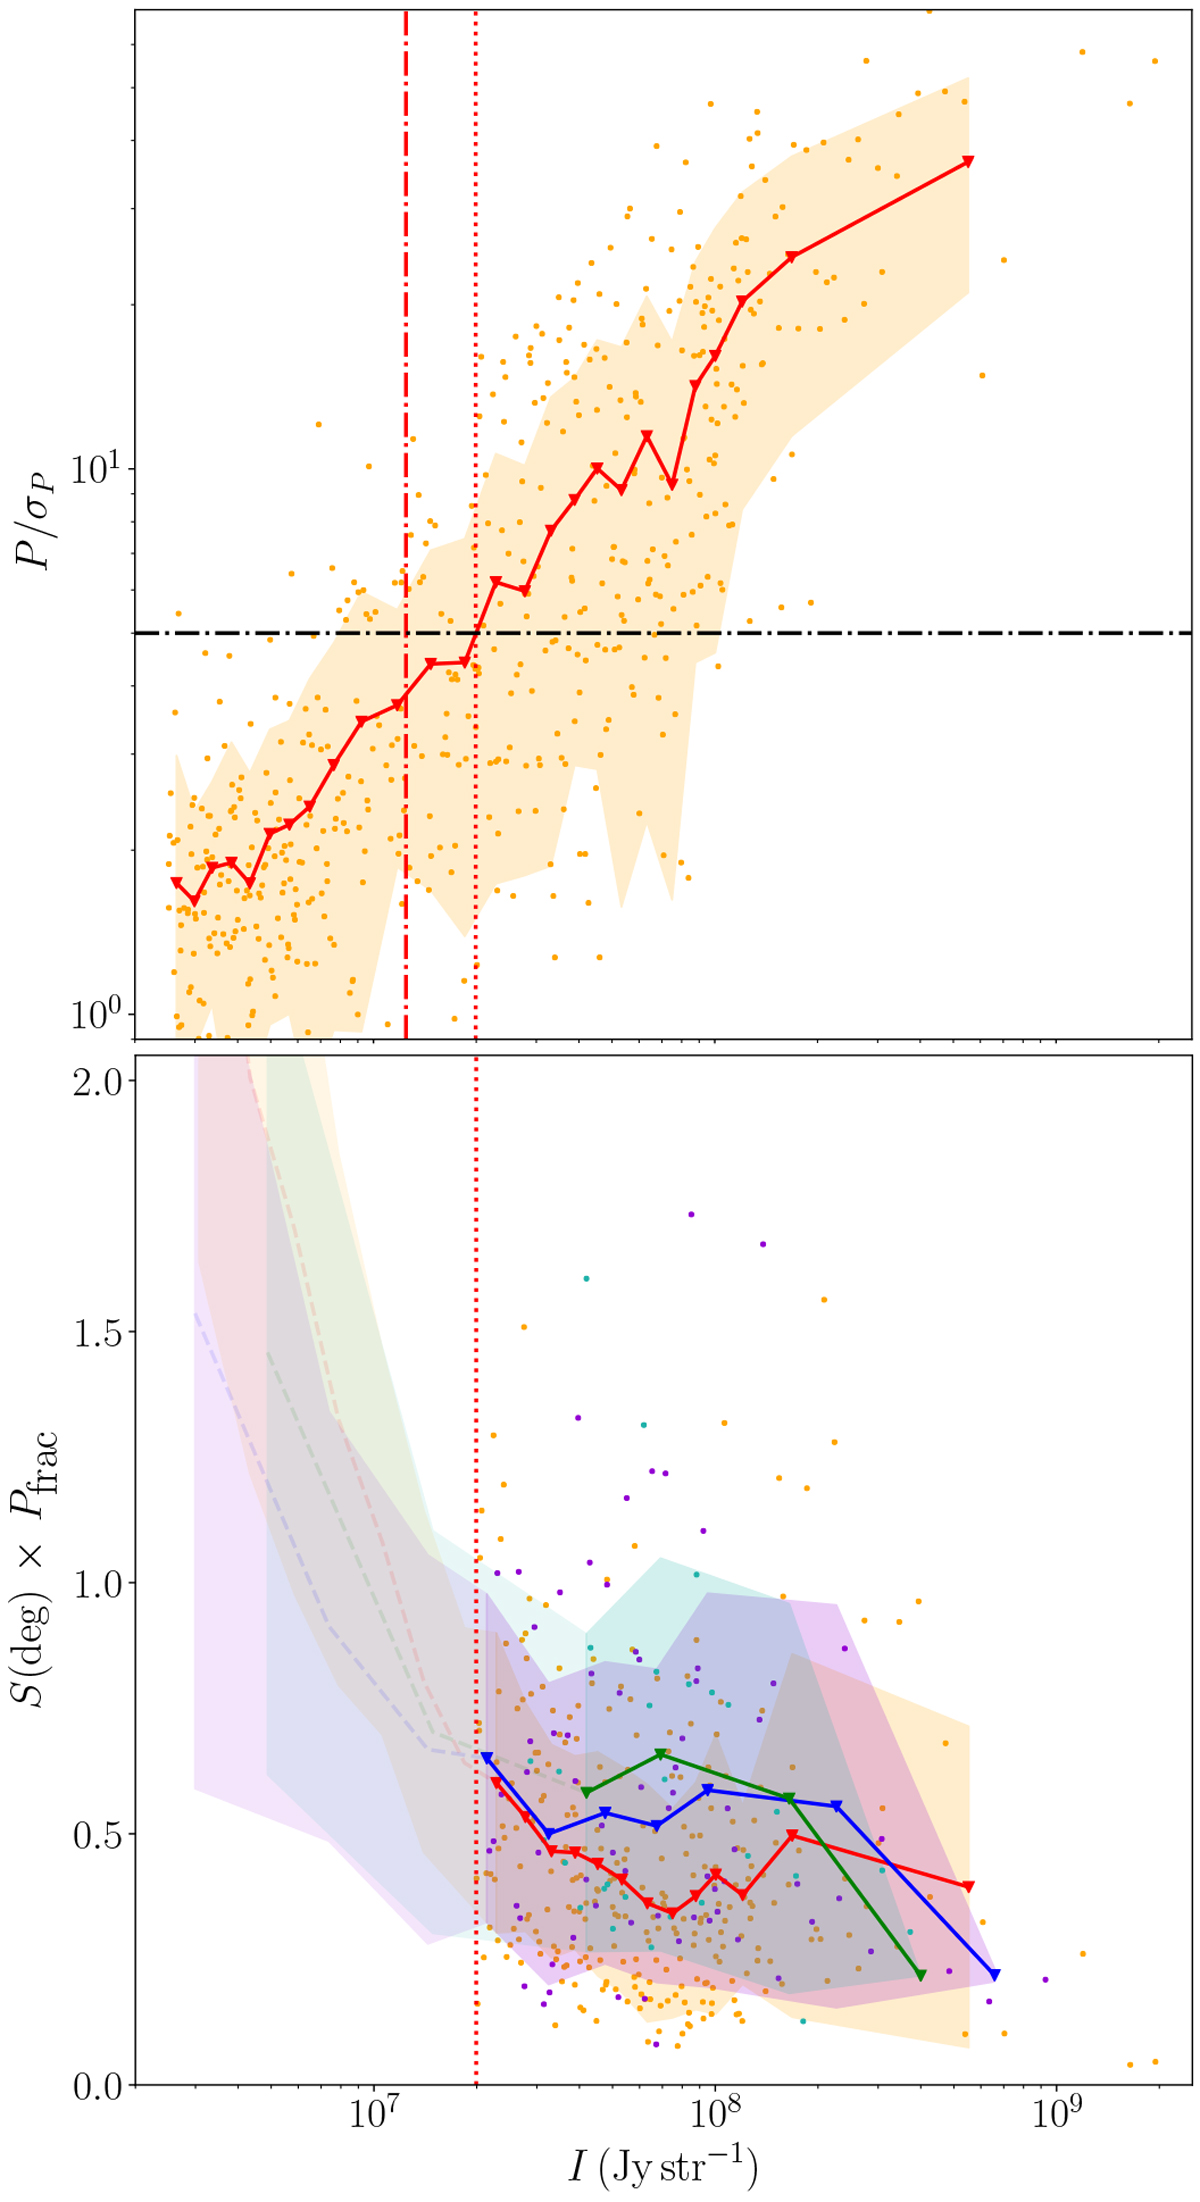
Illustration of how we compute the pixel-selection cutoff in Stokes I
in the 1.3 mm observation of the B335 core. Top: evolution of the S/N of the polarized intensity, i.e.,
P∕σP, as a functionof the total intensity Stokes I
in Jy str−1. The dot-dashed horizontal black line is at the value of P∕σP = 5. The dotted vertical line is the selected cutoff in Stokes I
described in Sect. 3.1. The dot-dashed vertical line is the 5σI
value. The solid line is the running mean, which is calculated along the Stokes
I; the shaded area represents ± the standard deviation of the Gaussian fit performed on each bin. Bottom:
![]() for the selected pixels as a function of the total intensity. To the left of the cutoff in Stokes
I
(the red dotted line, plotted as in the top panel), the points are no longer plotted and the running mean turns in a translucent dashed line. Each color corresponds to an angular resolution: red is the original resolution, whereas blue and green are 4 × and 9 × lower resolution (in terms of beam area), respectively. We note that, as expected, one see that decreasing the resolution, and thus increasing the spatial length of the lag, causes on the dispersion
for the selected pixels as a function of the total intensity. To the left of the cutoff in Stokes
I
(the red dotted line, plotted as in the top panel), the points are no longer plotted and the running mean turns in a translucent dashed line. Each color corresponds to an angular resolution: red is the original resolution, whereas blue and green are 4 × and 9 × lower resolution (in terms of beam area), respectively. We note that, as expected, one see that decreasing the resolution, and thus increasing the spatial length of the lag, causes on the dispersion
![]() to increase as well, on average (see Sect. 2.1).
to increase as well, on average (see Sect. 2.1).
Current usage metrics show cumulative count of Article Views (full-text article views including HTML views, PDF and ePub downloads, according to the available data) and Abstracts Views on Vision4Press platform.
Data correspond to usage on the plateform after 2015. The current usage metrics is available 48-96 hours after online publication and is updated daily on week days.
Initial download of the metrics may take a while.