Fig. B.4
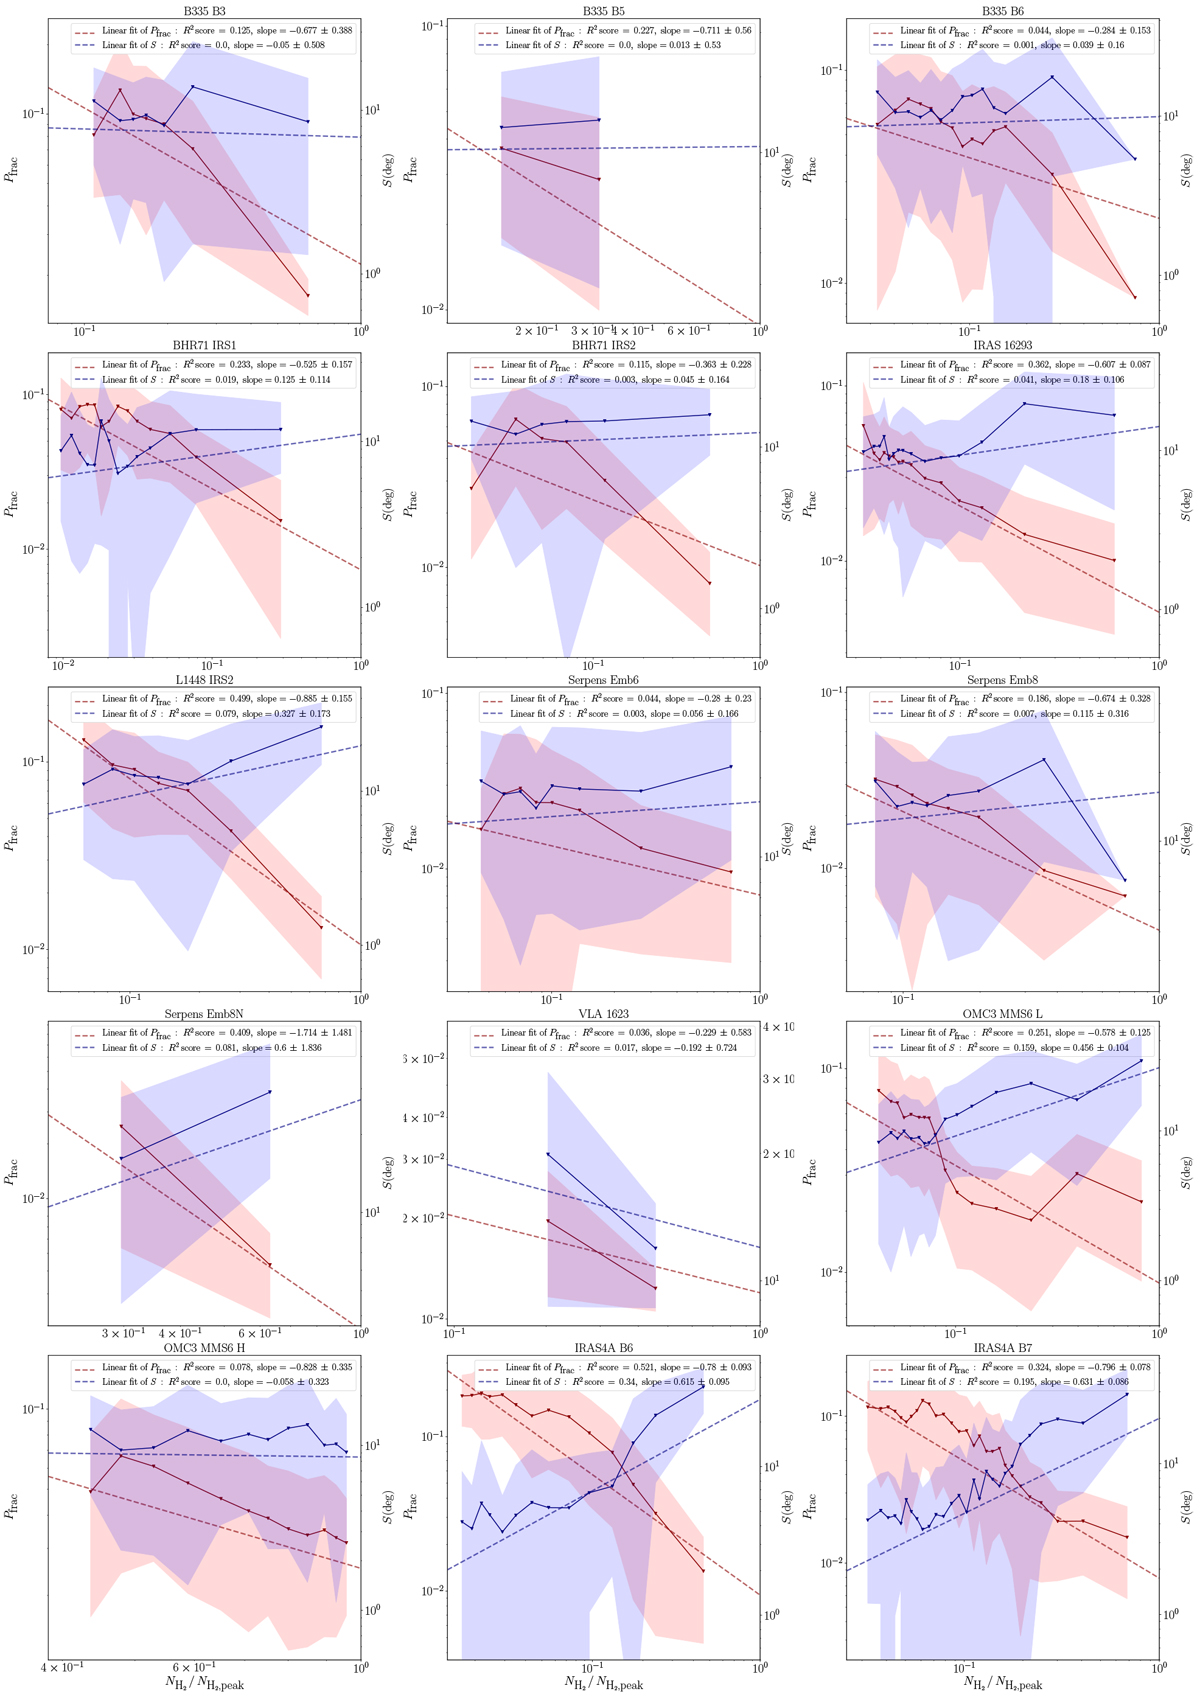
Distributions of the dispersion of polarization position angles ![]() (blue) and the polarization fraction
(blue) and the polarization fraction ![]() (red) as a function of the normalized column density
(red) as a function of the normalized column density ![]() , for all the cores. The solid lines and points represent the running mean of
, for all the cores. The solid lines and points represent the running mean of
![]() and
and ![]() ; the associated shaded areas are ± the standard deviation of each bin. The dashed lines are the linear fits, which are linear regressions done in the logarithmic space, whose slopes and uncertainties are calculated the same way as in Fig. 4.
; the associated shaded areas are ± the standard deviation of each bin. The dashed lines are the linear fits, which are linear regressions done in the logarithmic space, whose slopes and uncertainties are calculated the same way as in Fig. 4.
Current usage metrics show cumulative count of Article Views (full-text article views including HTML views, PDF and ePub downloads, according to the available data) and Abstracts Views on Vision4Press platform.
Data correspond to usage on the plateform after 2015. The current usage metrics is available 48-96 hours after online publication and is updated daily on week days.
Initial download of the metrics may take a while.