Fig. 10
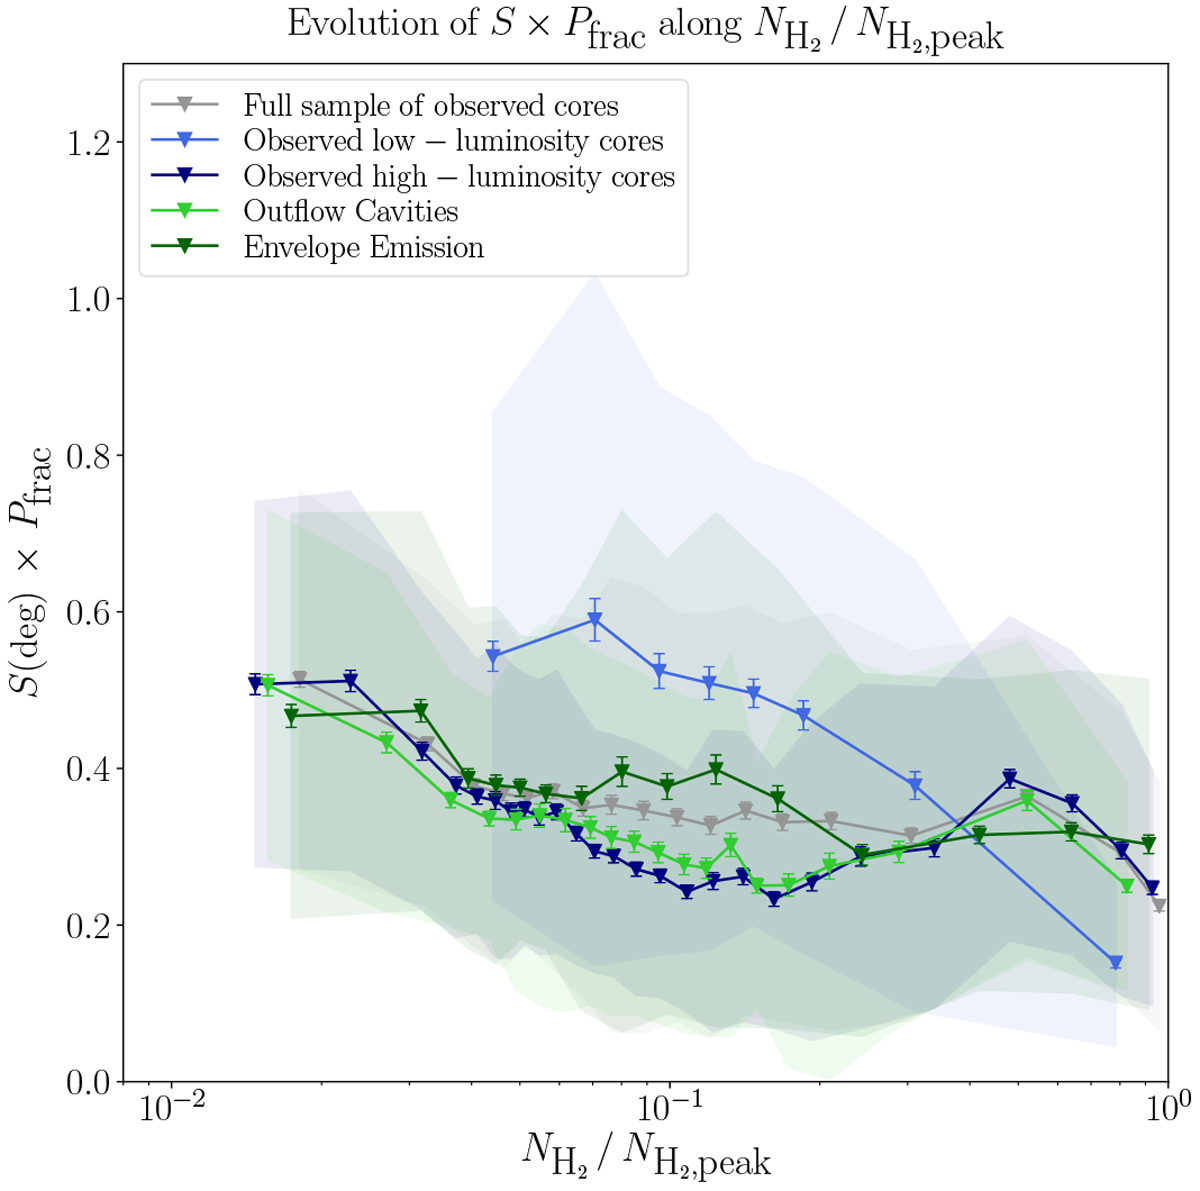
Observed distributions of ![]() as a functionof the column density
as a functionof the column density ![]() , which is normalized to its maximum value
, which is normalized to its maximum value ![]() , for all the cores, and for other cases we tried, including separating high- and low-luminosity cores, as well as outflow cavity walls versus envelope emission. The solid lines are the running means, and the shaded areas are
± the standard deviation of each bin of points. The error bars correspond to these standard deviation values divided by the square root of the number of points in each bin.
, for all the cores, and for other cases we tried, including separating high- and low-luminosity cores, as well as outflow cavity walls versus envelope emission. The solid lines are the running means, and the shaded areas are
± the standard deviation of each bin of points. The error bars correspond to these standard deviation values divided by the square root of the number of points in each bin.
Current usage metrics show cumulative count of Article Views (full-text article views including HTML views, PDF and ePub downloads, according to the available data) and Abstracts Views on Vision4Press platform.
Data correspond to usage on the plateform after 2015. The current usage metrics is available 48-96 hours after online publication and is updated daily on week days.
Initial download of the metrics may take a while.