Fig. 5.
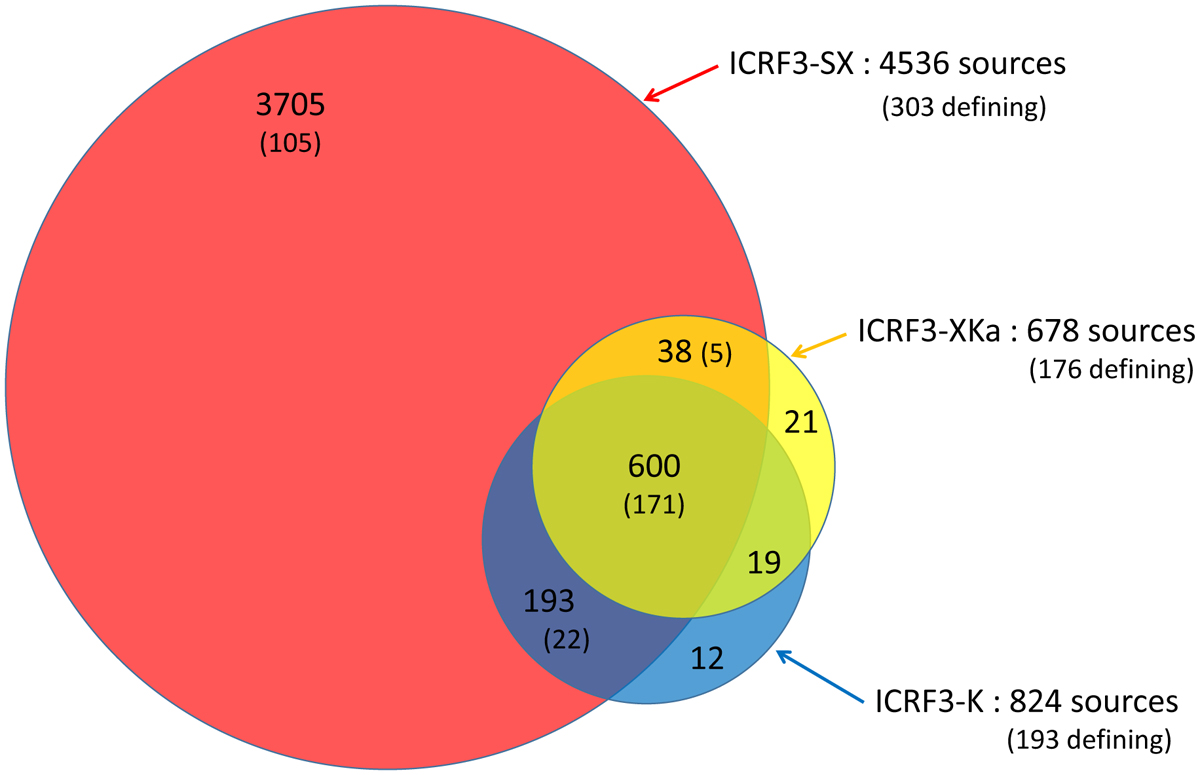
Breakdown of the 4588 sources in ICRF3 according to frequency band. The circle colored red is for S/X band, the one colored blue is for K band, and the one colored yellow is for X/Ka band. The number of sources found in each colored area is printed within that area, with the number of ICRF3 defining sources (see Sect. 5.2) given in parentheses.
Current usage metrics show cumulative count of Article Views (full-text article views including HTML views, PDF and ePub downloads, according to the available data) and Abstracts Views on Vision4Press platform.
Data correspond to usage on the plateform after 2015. The current usage metrics is available 48-96 hours after online publication and is updated daily on week days.
Initial download of the metrics may take a while.