Fig. 21.
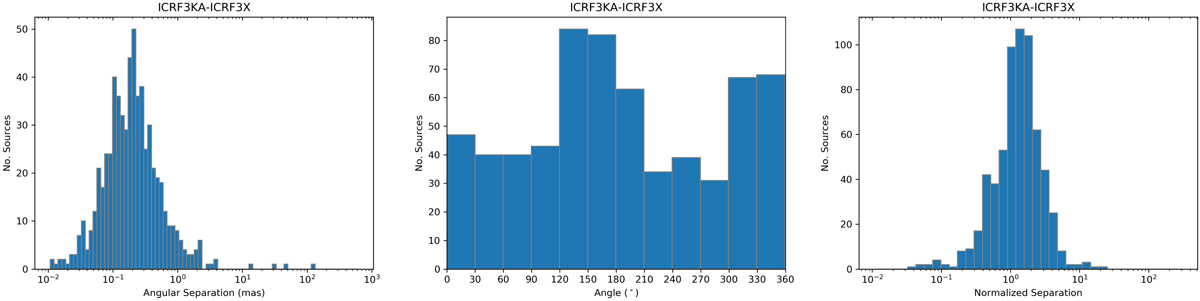
Comparison of the ICRF3 positions at S/X band and X/Ka band for the 638 sources common to the two catalogs. Position differences were derived after applying the transformation in Table 13 to the X/Ka band source coordinates. The histogram in the left-hand panel shows the distribution of the angular separation between the two sets of positions, that in the middle panel shows the distribution of the direction of the offset vector joining those positions (counted counter clockwise), and that in the right-hand panel the distribution of the normalized separation.
Current usage metrics show cumulative count of Article Views (full-text article views including HTML views, PDF and ePub downloads, according to the available data) and Abstracts Views on Vision4Press platform.
Data correspond to usage on the plateform after 2015. The current usage metrics is available 48-96 hours after online publication and is updated daily on week days.
Initial download of the metrics may take a while.