Open Access
Fig. 14.
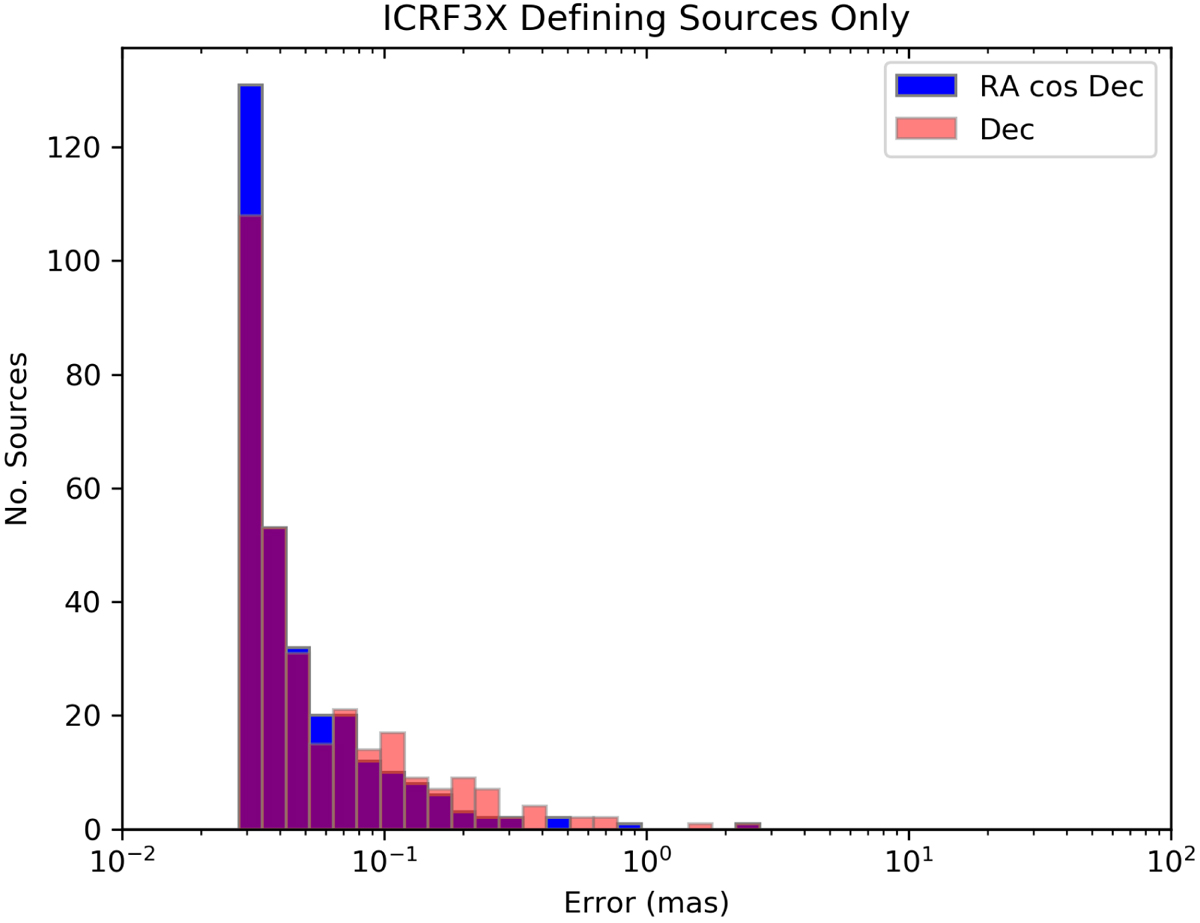
Distribution of coordinate uncertainties of the 303 ICRF3 defining sources at S/X band. Right ascension is shown in blue while declination is shown in salmon. The superimposed portion of the two distributions is shown in purple.
Current usage metrics show cumulative count of Article Views (full-text article views including HTML views, PDF and ePub downloads, according to the available data) and Abstracts Views on Vision4Press platform.
Data correspond to usage on the plateform after 2015. The current usage metrics is available 48-96 hours after online publication and is updated daily on week days.
Initial download of the metrics may take a while.