Open Access
Fig. 13.
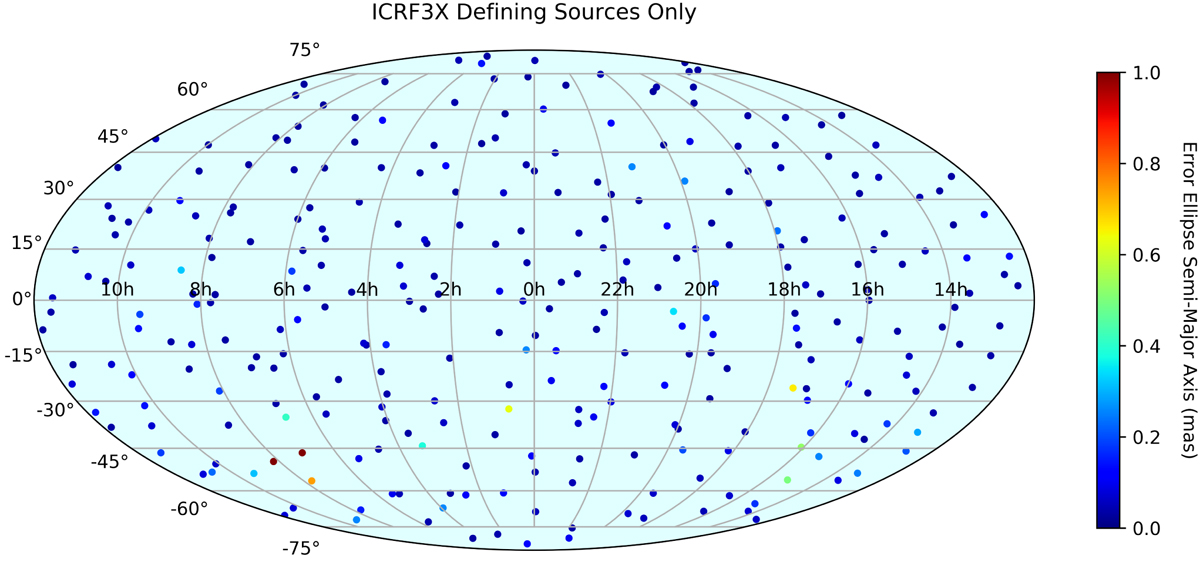
Sky distribution of the 303 ICRF3 defining sources. Each source is plotted as a dot color-coded according to its position uncertainty in the S/X band frame (where the position uncertainty is defined as the semi-major axis of the error ellipse in position).
Current usage metrics show cumulative count of Article Views (full-text article views including HTML views, PDF and ePub downloads, according to the available data) and Abstracts Views on Vision4Press platform.
Data correspond to usage on the plateform after 2015. The current usage metrics is available 48-96 hours after online publication and is updated daily on week days.
Initial download of the metrics may take a while.