Fig. 11.
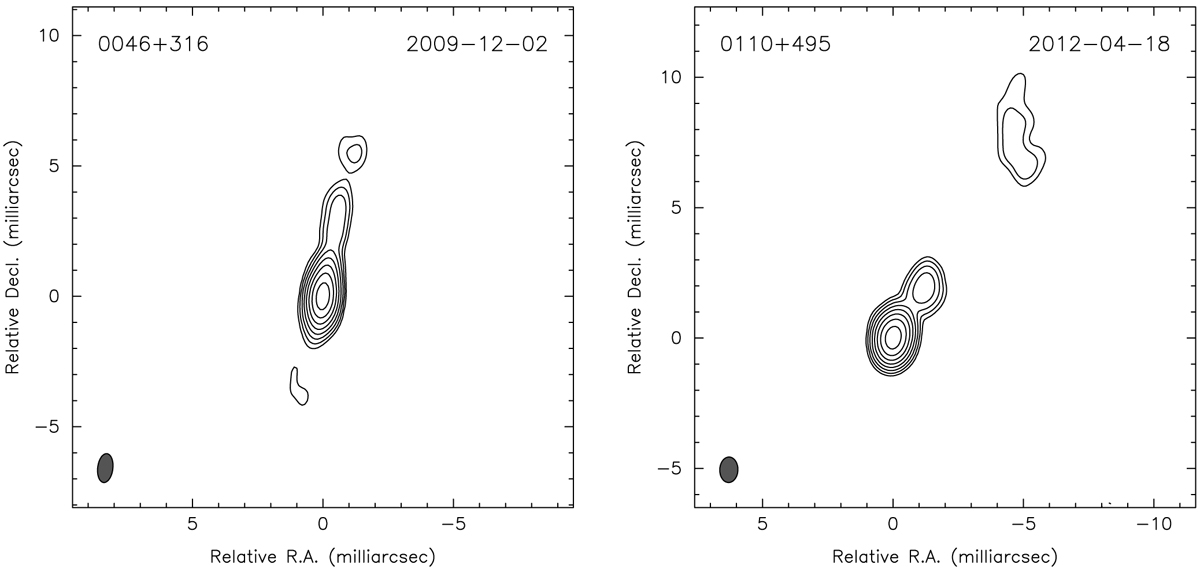
VLBI maps at X band of two ICRF3 defining sources with structural morphology in category B. Contour levels are drawn at ±0.5, 1, 2, 4, 8, 16, 32, and 64% of the peak brightness. The labels in each plot specify the source name and the epoch of the observations. These maps (retrieved from BVID) were made from data from RDV sessions.
Current usage metrics show cumulative count of Article Views (full-text article views including HTML views, PDF and ePub downloads, according to the available data) and Abstracts Views on Vision4Press platform.
Data correspond to usage on the plateform after 2015. The current usage metrics is available 48-96 hours after online publication and is updated daily on week days.
Initial download of the metrics may take a while.