Fig. A.1.
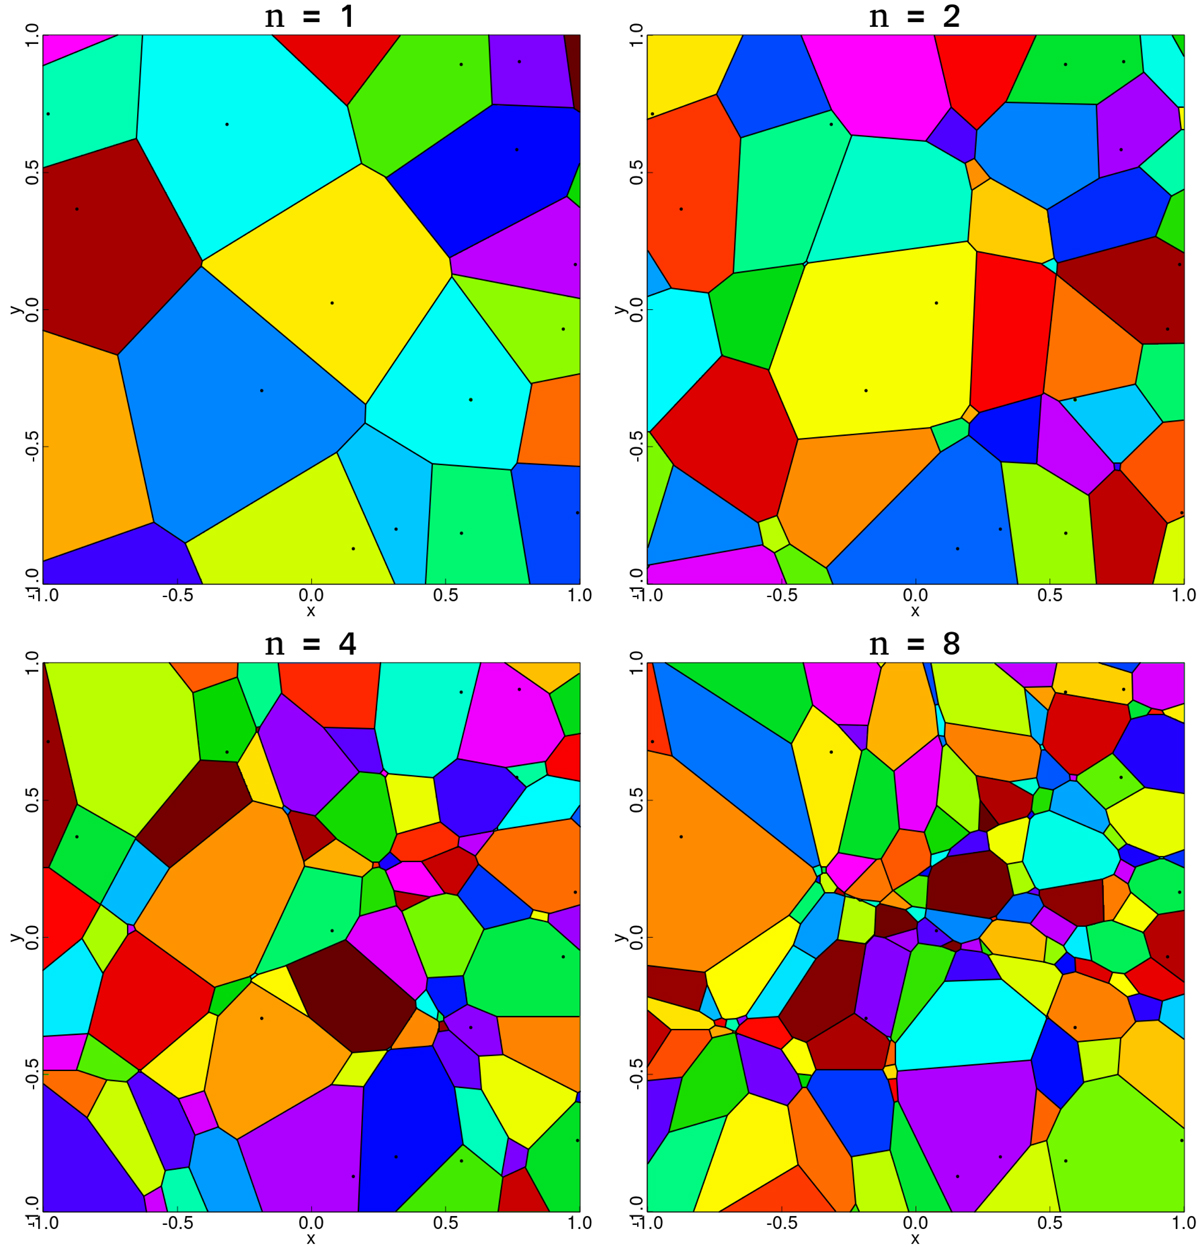
Voronoi diagrams of orders 1, 2, 4, and 8 of a uniformly distributed (x, y) toy seed points set where x ∈ [ − 1.5, 1.5] and y ∈ [ − 1.5, 1.5]. Each panel only shows x ∈ [ − 1, 1],y ∈ [ − 1, 1] to avoid window effects. The toy set is the same for each panel, but the order is different (n = 1, 2, 4, and 8, shown on top of each panel). The seed points are shown as small black circles, while each cell is randomly colored in the background and their borders delimited by solid black lines.
Current usage metrics show cumulative count of Article Views (full-text article views including HTML views, PDF and ePub downloads, according to the available data) and Abstracts Views on Vision4Press platform.
Data correspond to usage on the plateform after 2015. The current usage metrics is available 48-96 hours after online publication and is updated daily on week days.
Initial download of the metrics may take a while.