Fig. 4.
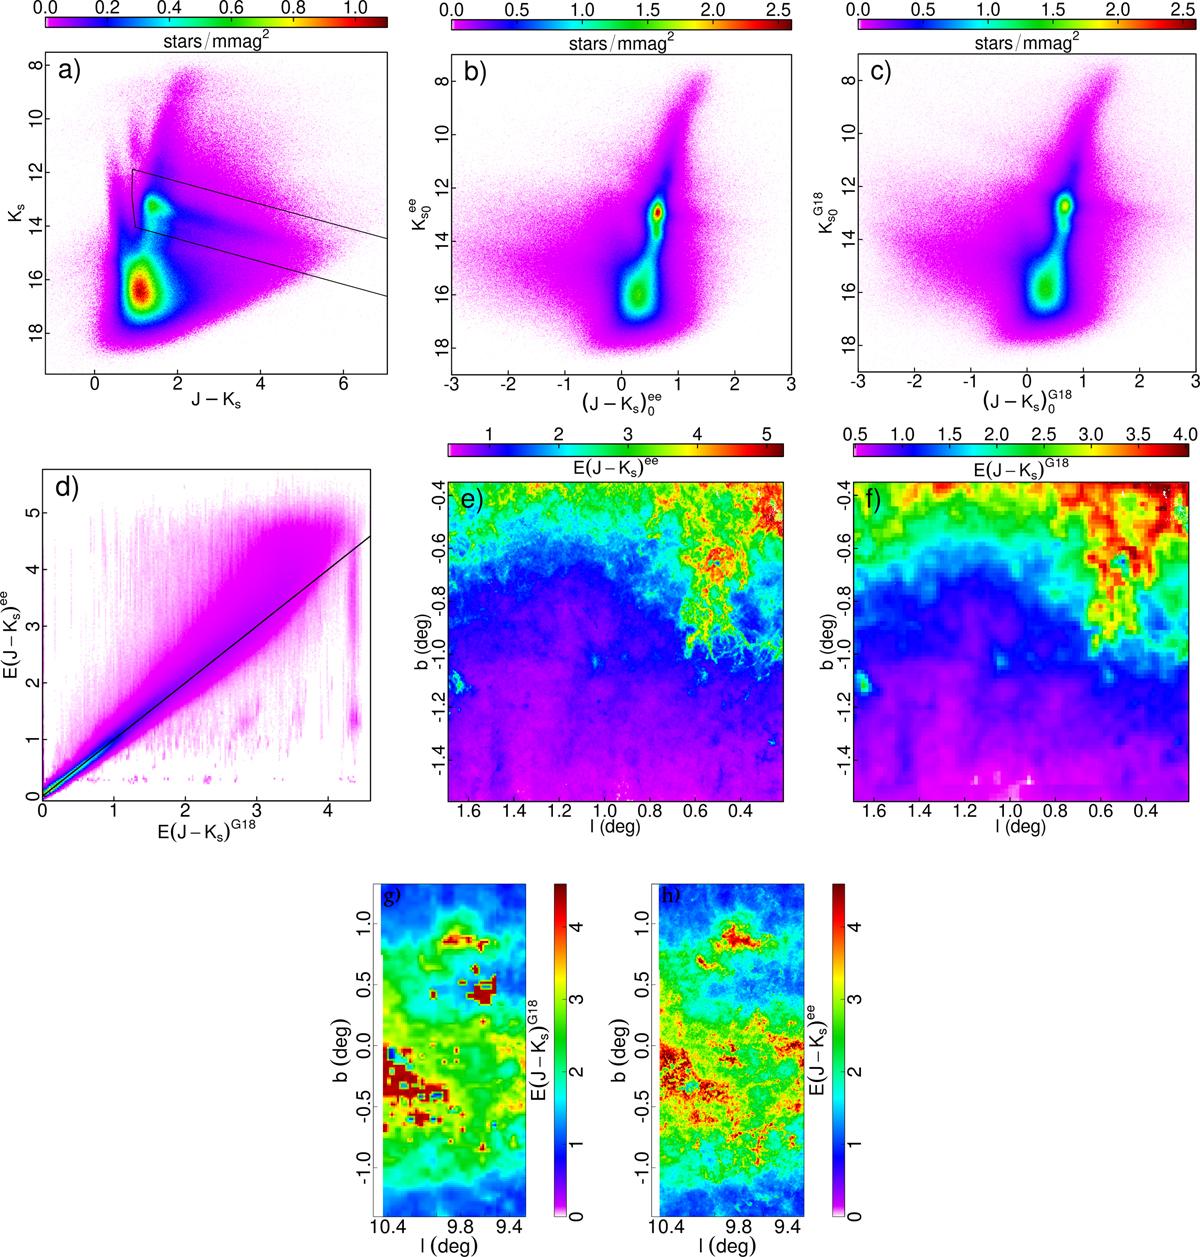
Comparison set of the map presented in this paper and G18. Panel a: uncorrected CMD for b320, the solid line represents the selection window used to define the RC+RGB sample, as explained in the text. Panel b: reddening corrected CMD for b320, using the map in panel e (this work’s). Panel c: reddening corrected CMD for b320, using the map in panel f (G18). Both this panel and panel b use the same reddening law (see Sect. 3.1) and scale in color, so it can be appreciated the way the RC in this panel is off and slanted redward. Panel d: one-on-one comparison between the color excess values derived from this work (E(J − Ks)ee in plot) with those from G18 (E(J − Ks)G18 in plot) for the whole VVV bulge area. A color-coded density map (high density in deep red, low in magenta) with a square root filter has been used to cleanly appreciate the correspondence between G18 and this work’s color excess for low-reddening areas, while still portraying the upward trend where we find systematically higher E(J − Ks) in high extinction areas. The peculiar features near maximum and minimum E(J − Ks)G18 comes from some pixels near the Galactic center, a few high-extinction concentrations scattered around the bulge area, but mostly from a few glitches in G18 map near the Galactic plane. These are exemplified in panel g, where a small portion of the plane appears randomly jagged with constant excess areas from the original Gonzalez et al. (2012). Panel h shows the same area as panel g, but with this work’s realization.
Current usage metrics show cumulative count of Article Views (full-text article views including HTML views, PDF and ePub downloads, according to the available data) and Abstracts Views on Vision4Press platform.
Data correspond to usage on the plateform after 2015. The current usage metrics is available 48-96 hours after online publication and is updated daily on week days.
Initial download of the metrics may take a while.