Fig. 2.
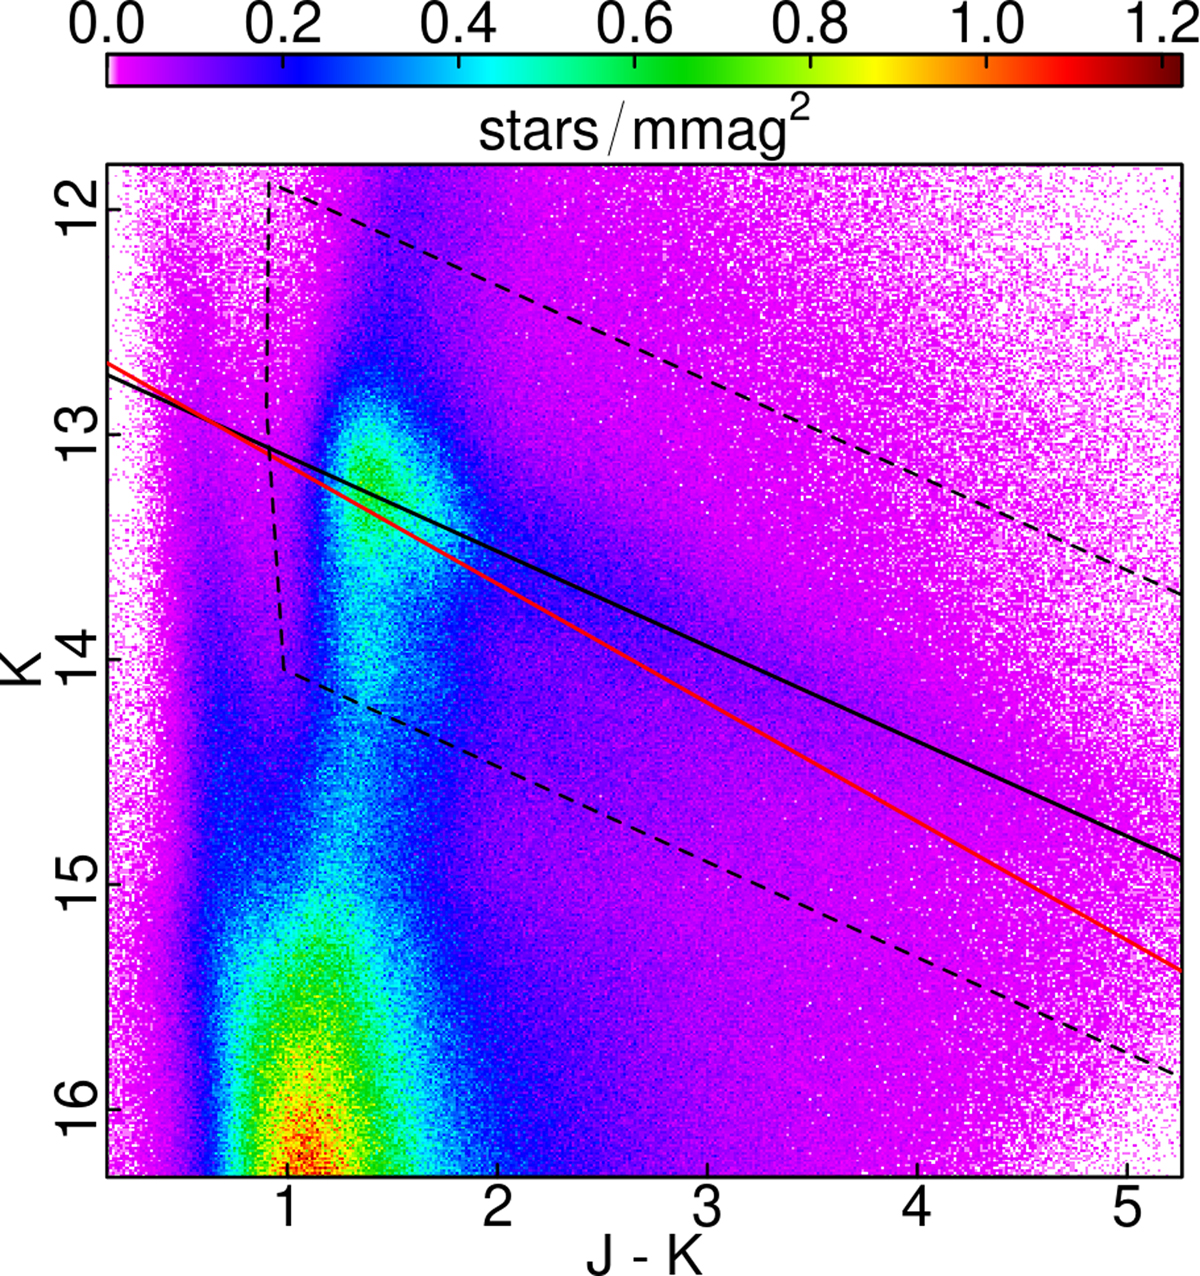
Zoomed-in Hess diagram of the selected field b320. Solid black line follows the derived reddening vector (see text), while the dashed black box defines the polygon-region used to select the stars in the sample for the color excess calculations. Additionally, the red solid line follows Nishiyama et al. (2009) reddening law, and intersects the solid black line at (J−Ks) = 0.635, which is roughly the (J−Ks)0 of the reddening corrected RC+RGB sequence at their peak overdensity in the CMD.
Current usage metrics show cumulative count of Article Views (full-text article views including HTML views, PDF and ePub downloads, according to the available data) and Abstracts Views on Vision4Press platform.
Data correspond to usage on the plateform after 2015. The current usage metrics is available 48-96 hours after online publication and is updated daily on week days.
Initial download of the metrics may take a while.