Fig. 1.
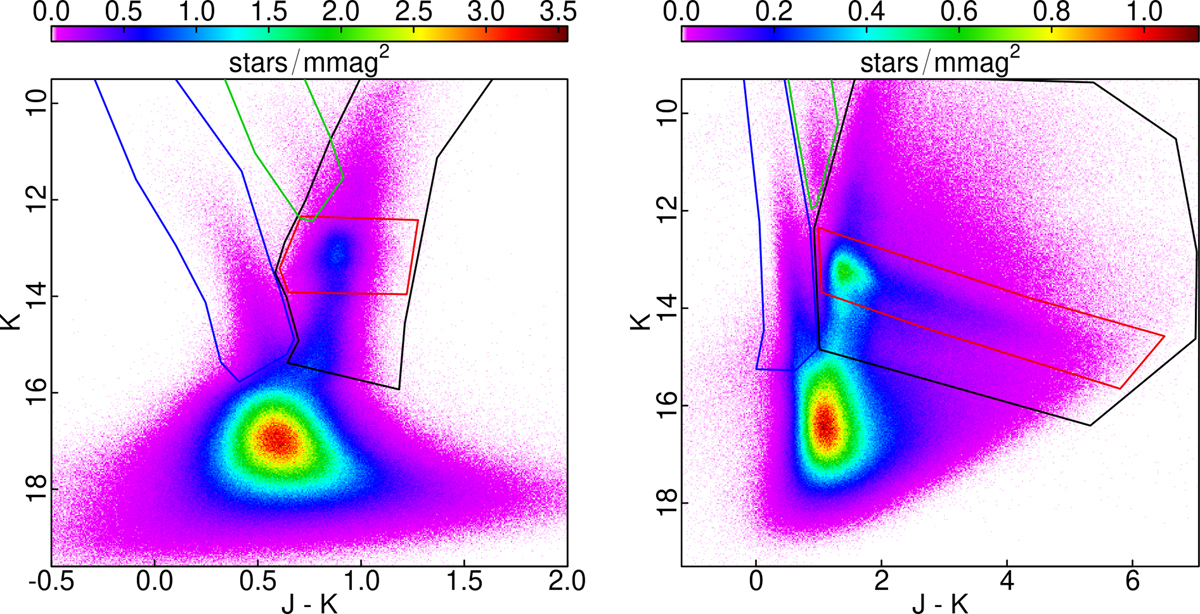
Hess diagram of tiles b278 (left panel; l ≈ 1° and b ≈ −4°, with 0.12 ≲ E(J − Ks)≲0.67) and b320 (right panel; l ≈ 1° and b ≈ −1°, with 0.40 ≲ E(J − Ks)≲5.30). Different polygons are used to roughly highlight some of the sampled evolutionary sequences: the bright disk MS (blue polygon), the bulge RGB (black polygon), the RC (red polygon), and the blue plume of evolved disk sequence (green polygon).
Current usage metrics show cumulative count of Article Views (full-text article views including HTML views, PDF and ePub downloads, according to the available data) and Abstracts Views on Vision4Press platform.
Data correspond to usage on the plateform after 2015. The current usage metrics is available 48-96 hours after online publication and is updated daily on week days.
Initial download of the metrics may take a while.