Fig. 3
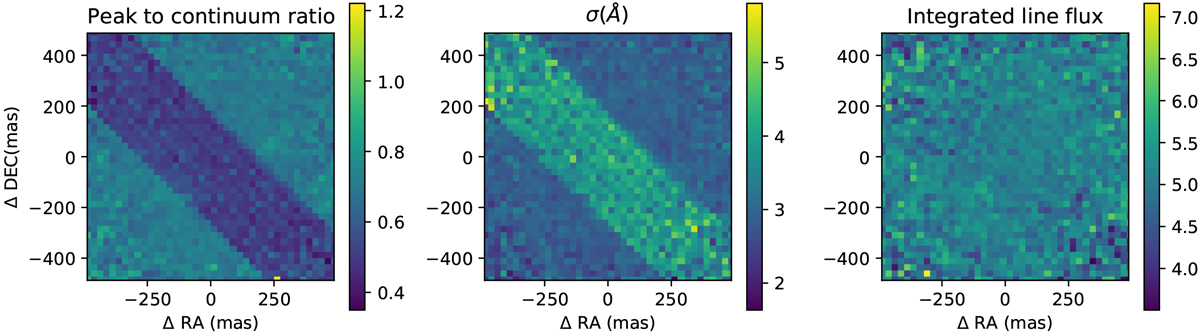
One of most affected datacubes from the observations of PDS70. The broad band is aligned with the slicer orientation if transformed to x-y instrument coordinates. Left figure: peak-to-continuum ratio. Middle figure: measured line width. There is a strong negative correlation between the line width and the peak to continuum ratio. Right figure: total line integrated flux, which is constant over the field. This indicates that the LSF is varying over the field.
Current usage metrics show cumulative count of Article Views (full-text article views including HTML views, PDF and ePub downloads, according to the available data) and Abstracts Views on Vision4Press platform.
Data correspond to usage on the plateform after 2015. The current usage metrics is available 48-96 hours after online publication and is updated daily on week days.
Initial download of the metrics may take a while.