Free Access
Fig. 13
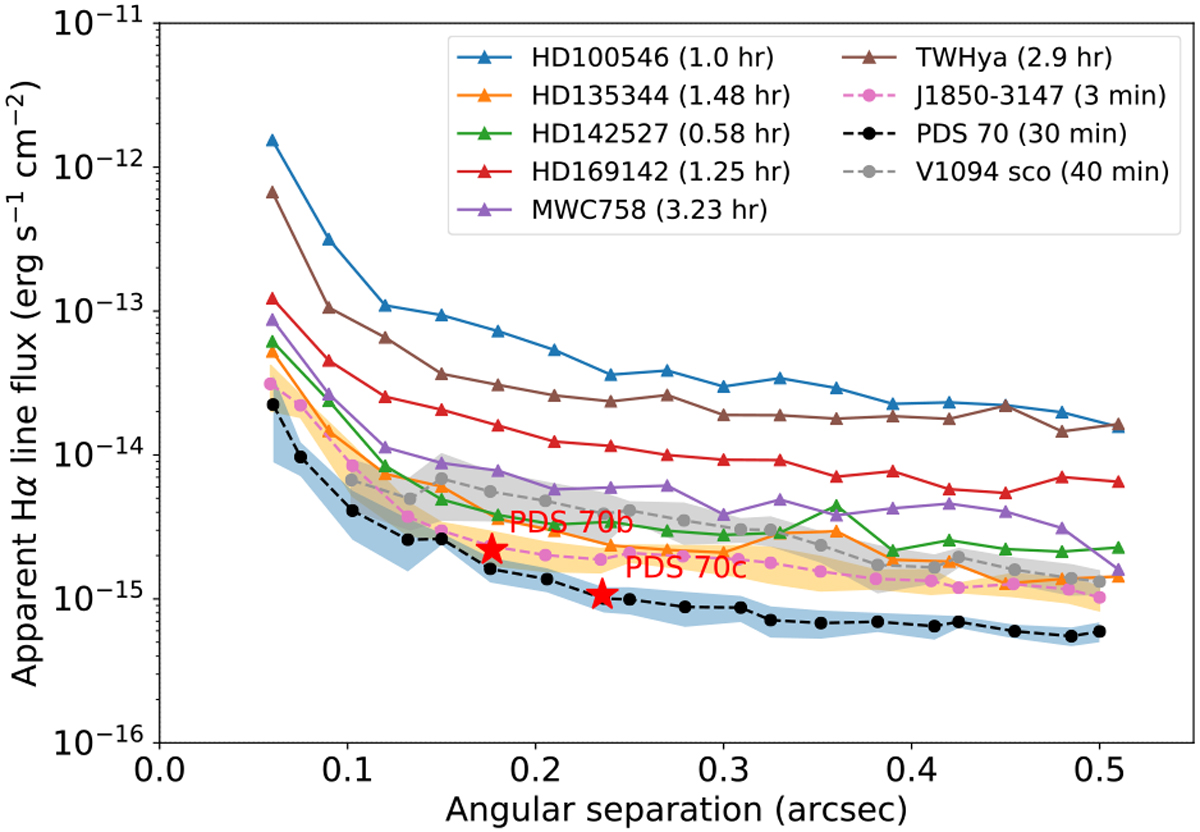
Detection limits (5σ) in apparent flux obtained with MUSE (dashed lines with colored shaded regions), together with the detection limits of ZIMPOL (solid lines with triangle markers; Cugno et al. 2019). The total integration time is listed after the target name. PDS 70 b and c from Haffert et al. (2019) is also shown.
Current usage metrics show cumulative count of Article Views (full-text article views including HTML views, PDF and ePub downloads, according to the available data) and Abstracts Views on Vision4Press platform.
Data correspond to usage on the plateform after 2015. The current usage metrics is available 48-96 hours after online publication and is updated daily on week days.
Initial download of the metrics may take a while.