Fig. 11
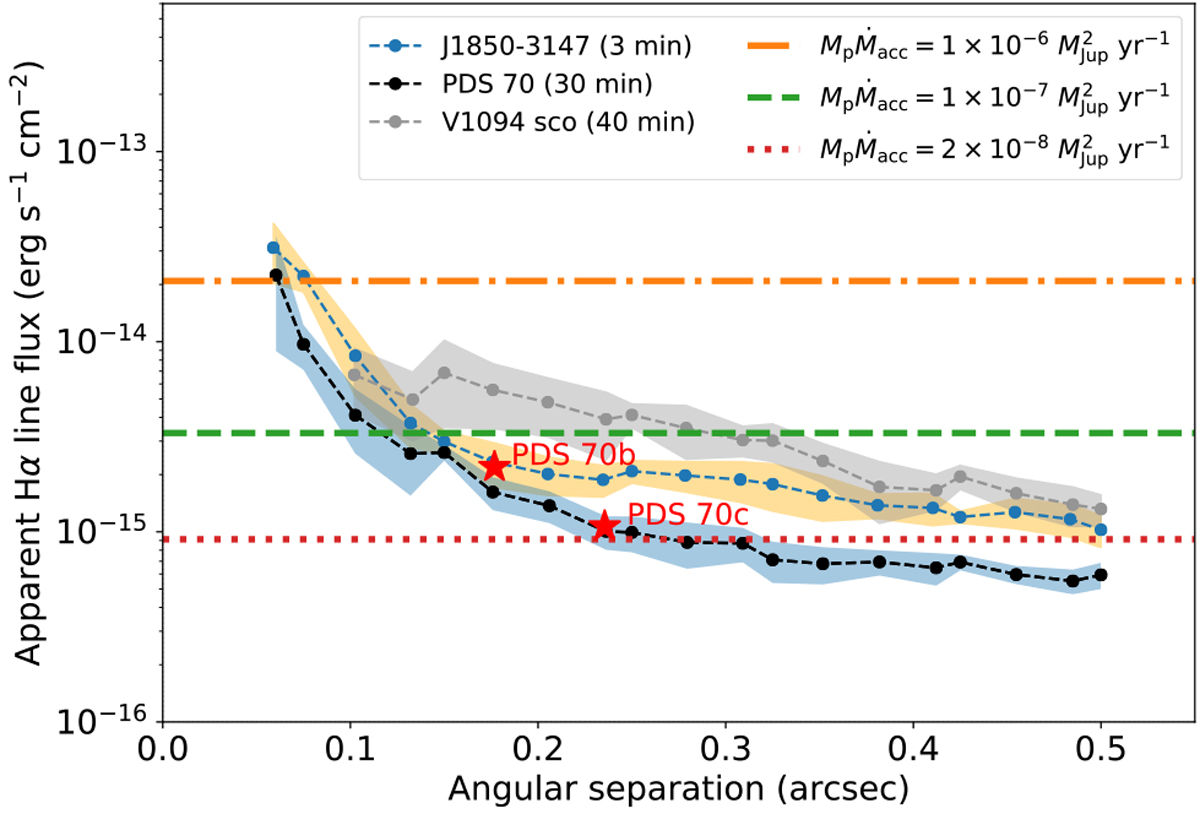
Detection limits in apparent Hα line flux at 5σ confidence levels. The colored shaded regions around each curve represent the standard deviation of the contrasts obtained at eight PAs. PDS 70 b and c from Haffert et al. (2019) are shown as red stars. The three horizontal lines show predicted Hα emission estimated from Gullbring et al. (1998) and Rigliaco et al. (2012). The detailed estimation can be found in Sect. 6.2
Current usage metrics show cumulative count of Article Views (full-text article views including HTML views, PDF and ePub downloads, according to the available data) and Abstracts Views on Vision4Press platform.
Data correspond to usage on the plateform after 2015. The current usage metrics is available 48-96 hours after online publication and is updated daily on week days.
Initial download of the metrics may take a while.