Fig. 10
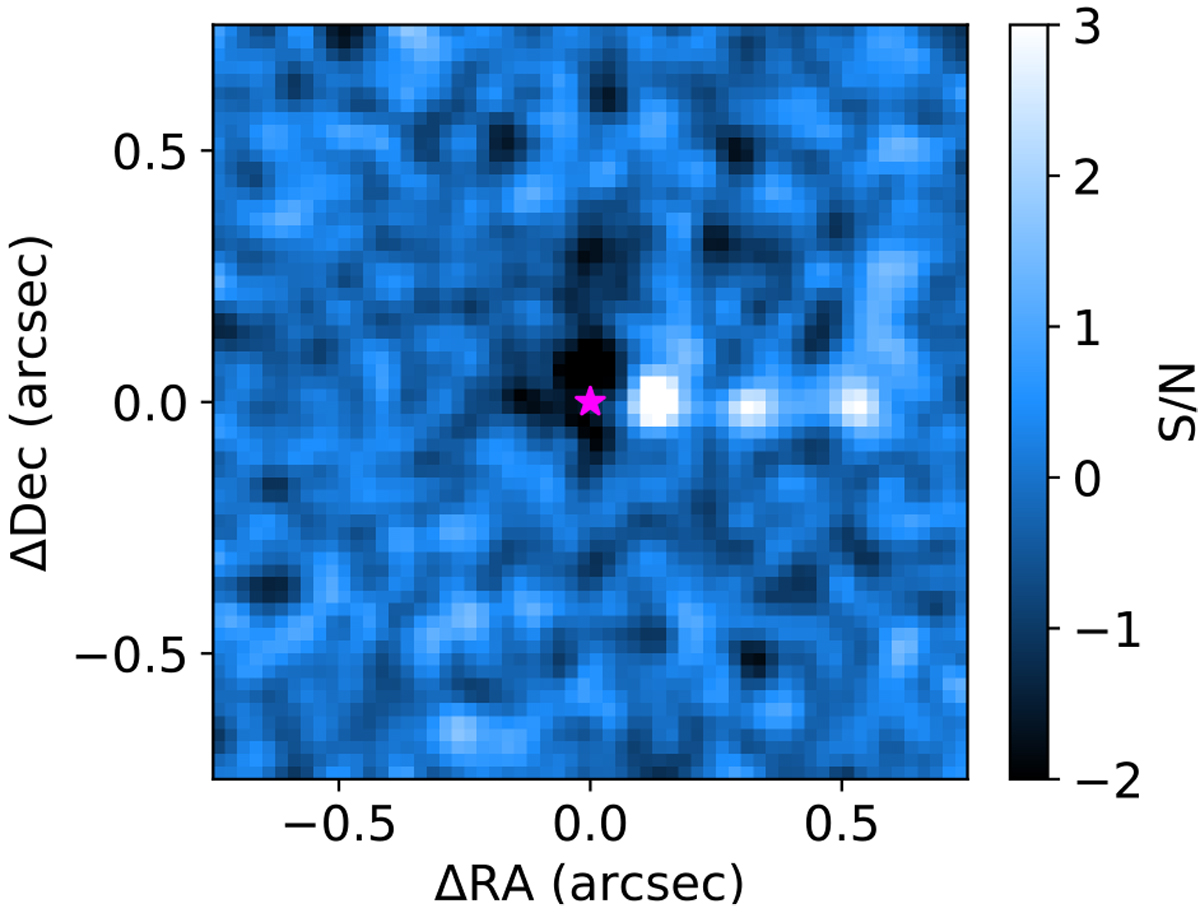
S/N map of J1850-3147 at Hα after the process of HRSDI is shown. For visual inspection of the contrast curve derived from Eq. (3), three 5σ fake planets were injected at distances of 0.1′′, 0.3′′, and 0.5′′. All three fake planets are clearly visible. For display purposes, the image was smoothed with a Gaussian kernel of 2 pixels in radius. The magenta star indicates the star center.
Current usage metrics show cumulative count of Article Views (full-text article views including HTML views, PDF and ePub downloads, according to the available data) and Abstracts Views on Vision4Press platform.
Data correspond to usage on the plateform after 2015. The current usage metrics is available 48-96 hours after online publication and is updated daily on week days.
Initial download of the metrics may take a while.